
Spices & Condiments Nutrition Facts: 40 Complete Profiles
The most detailed spice nutrition reference in one place — macros, vitamins, minerals, and key phytochemicals per 100 g for 40 Indian and global spices. Data sourced from USDA FoodData Central SR Legacy, ICMR-NIN IFCT 2017, and peer-reviewed literature.
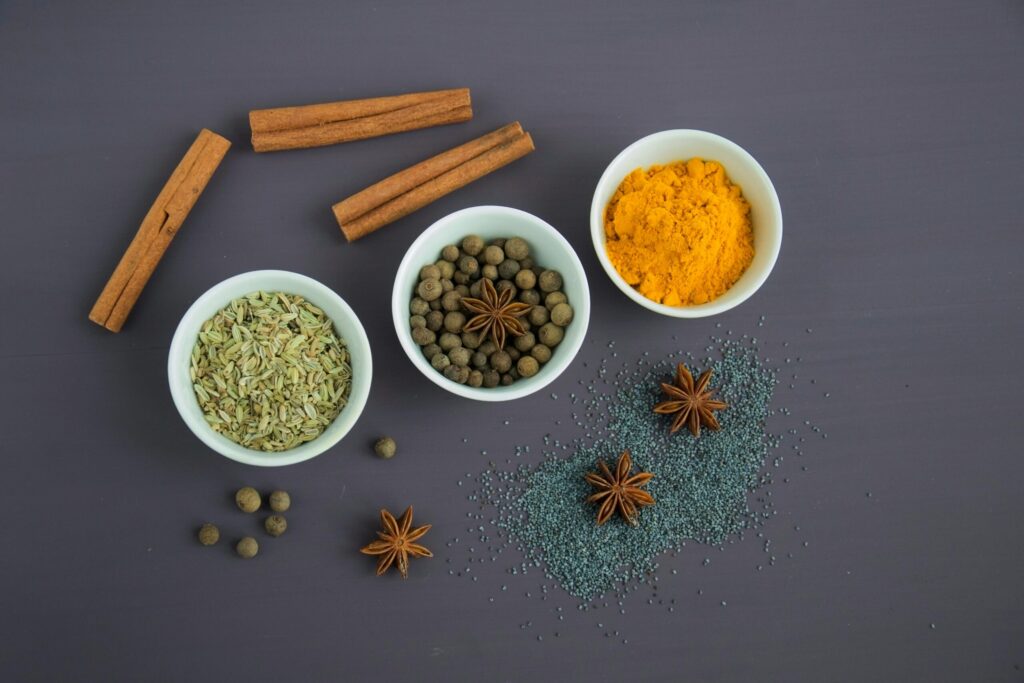
Our Spices and Condiments Nutrition Facts database offers an exhaustive look at the world’s most flavorful ingredients. This comprehensive guide features 40+ nutritional profiles, providing a detailed breakdown of macros and micronutrients for every item listed. By studying these Condiments and Spices Nutrition Facts, you can discover the high antioxidants in herbs and spices and the unique nutritional value of Indian condiments like turmeric, cumin, and coriander. Whether you are researching the medicinal properties of spices database or checking the macros and micronutrients in seasonings, these Spices & Condiments Nutrition Facts ensure you have the precise data needed to enhance both the taste and health of your meals.
Why Spice Nutrition Actually Matters
Most nutrition databases treat spices as an afterthought — a seasoning category given a single line of macros and nothing more. That misses nearly everything important about them. Spices are among the most nutrient-dense ingredients on earth by weight. A teaspoon of dried fenugreek delivers more iron per gram than beef liver. A gram of cloves contains more antioxidant eugenol than most herbal supplements. Turmeric’s curcumin has been the subject of over 10,000 published studies. The fact that we use them in small quantities doesn’t mean their nutritional profile is negligible — it means we need a database that presents the data accurately so the information is actually useful.
🔍 What makes this database different: Most spice guides publish energy and macros. This one adds the full vitamin and mineral profile plus the key phytochemical for each item — with a plain-language explanation of what it does. Indian-origin spices that are absent or incomplete in international databases (hing, ajwain, kalonji, curry leaves, amchur, chaat masala, sambar powder) are covered in full.
What Spices Actually Do in the Body
Spices are not just flavour carriers. They contain biologically active molecules — phytochemicals, volatile oils, and phenolic compounds — that interact directly with human physiology. The distinction between a spice as “seasoning” and a spice as “functional food ingredient” has become increasingly hard to maintain as the research base grows. Here is what is actually happening when these compounds enter the body.
Thermogenesis
Capsaicin in chili binds TRPV1 receptors, triggering heat production and mild appetite suppression. Black pepper’s piperine has a weaker but similar effect.
Anti-inflammation
Curcumin (turmeric), gingerols (ginger), and eugenol (cloves) inhibit NF-κB, a central inflammatory signalling pathway. Bioavailability is the primary limitation.
Enzyme inhibition
Piperine inhibits CYP3A4 and P-glycoprotein enzymes, boosting the bioavailability of curcumin and several pharmaceutical drugs by 1,000–2,000%.
Glycaemic modulation
Fenugreek’s 4-hydroxyisoleucine stimulates insulin secretion. Cinnamon’s cinnamaldehyde improves insulin sensitivity. Both have small-scale clinical evidence.
Antimicrobial action
Thymol (ajwain/thyme), eugenol (cloves), and carvacrol (oregano) are potent antimicrobials. They disrupt microbial cell membranes at achievable culinary concentrations.
Antioxidant capacity
Cloves, turmeric, cinnamon, and oregano rank among the highest-ORAC foods ever measured — exceeding most fruits and vegetables on a per-gram basis.
Macronutrient Profile (per 100 g)
The macronutrient range across spices is wider than most people expect. At one end, vinegar is virtually free of all macros (18 kcal, zero protein, zero fat). At the other, mustard seed delivers 469 kcal and 28.8 g fat per 100 g — a higher fat density than most nuts. Most dried spices sit between 250–380 kcal, driven predominantly by carbohydrate and fibre. The fibre values deserve particular attention: coriander seed (41.9 g/100 g), fennel (39.8 g), thyme (37 g), and fenugreek (24.6 g) are among the highest-fibre foods on earth per unit weight.
Reading tip: Typical spice use is 1–3 g per serving. To calculate real-world intake, multiply any 100 g value by the grams used, then divide by 100.
| Name (English) | Hindi Name | Category | Origin | Typical Use (g) | Energy (kcal) | Water (g) | Protein (g) | Total Fat (g) | Sat. Fat (g) | Carbs (g) | Fiber (g) | Sugars (g) | Sodium (mg) |
|---|---|---|---|---|---|---|---|---|---|---|---|---|---|
| Amchur (dry mango) | Amchur | Indian – souring | India | 2.0 g | 323 | 7.7 | 2.5 | 0.5 | 0.1 | 78.0 | 4.5 | 50.0 | 23.0 |
| Apple cider vinegar | Seb ka sirka | Condiment | USA | 15.0 g | 22 | 93.8 | 0.0 | 0.0 | 0.0 | 0.6 | 0.0 | 0.5 | 5.0 |
| Asafoetida (hing) | Hing | Indian – staple | Iran/Afghanistan | 0.5 g | 297 | 16.2 | 4.0 | 1.1 | 0.0 | 67.8 | 3.0 | 10.0 | 76.0 |
| Basil, dried | Basil | Global | Mediterranean | 1.0 g | 233 | 10.4 | 22.0 | 4.1 | 0.0 | 47.8 | 37.7 | 1.7 | 76.0 |
| Bay leaf, dried | Tejpatta | Indian – aromatic | India | 1.0 g | 313 | 5.4 | 7.6 | 8.4 | 2.3 | 74.9 | 26.3 | 0.0 | 23.0 |
| Black pepper, ground | Kali Mirch | Indian – staple | India | 2.0 g | 251 | 12.5 | 10.4 | 3.3 | 1.4 | 63.9 | 25.3 | 0.6 | 20.0 |
| Cardamom, ground | Elaichi | Indian – staple | India | 1.0 g | 311 | 8.3 | 10.8 | 6.7 | 0.7 | 68.5 | 28.0 | 0.0 | 18.0 |
| Carom seed (ajwain) | Ajwain | Indian – aromatic | India | 1.0 g | 305 | 7.4 | 15.9 | 25.0 | 0.0 | 43.1 | 21.2 | 0.0 | 10.0 |
| Chaat masala | Chaat masala | Indian – blend | India | 3.0 g | 280 | 9.0 | 10.0 | 8.0 | 1.5 | 60.0 | 18.0 | 5.0 | 4200.0 |
| Cinnamon, ground | Dalchini | Indian – aromatic | Sri Lanka | 2.0 g | 247 | 10.6 | 4.0 | 1.2 | 0.4 | 80.6 | 53.1 | 2.2 | 10.0 |
| Cloves, ground | Laung | Indian – aromatic | India | 1.0 g | 274 | 9.9 | 6.0 | 13.0 | 3.5 | 65.5 | 33.9 | 2.4 | 277.0 |
| Coconut milk (canned) | Nariyal doodh | Condiment | India/SE Asia | 30.0 g | 230 | 67.6 | 2.3 | 23.8 | 21.1 | 5.5 | 2.2 | 3.3 | 15.0 |
| Coriander seed | Dhania | Indian – staple | India | 2.0 g | 298 | 8.9 | 12.4 | 17.8 | 1.1 | 54.9 | 41.9 | 0.0 | 35.0 |
| Cumin seed | Jeera | Indian – staple | India/Iran | 2.0 g | 375 | 8.1 | 17.8 | 22.3 | 1.5 | 44.2 | 10.5 | 2.3 | 168.0 |
| Curry leaves, dried | Kari Patta | Indian – aromatic | India | 1.0 g | 108 | 8.5 | 6.1 | 1.0 | 0.2 | 18.7 | 2.9 | 0.0 | 12.0 |
| Curry powder | Curry powder | Global | UK/India | 3.0 g | 325 | 9.5 | 12.7 | 13.8 | 2.0 | 55.8 | 33.2 | 2.8 | 52.0 |
| Fennel seed | Saunf | Indian – aromatic | India | 2.0 g | 345 | 8.8 | 15.8 | 14.9 | 0.5 | 52.3 | 39.8 | 0.0 | 88.0 |
| Fenugreek seed | Methi dana | Indian – staple | India | 2.0 g | 323 | 8.8 | 23.0 | 6.4 | 1.5 | 58.4 | 24.6 | 0.0 | 67.0 |
| Garam masala | Garam masala | Indian – blend | India | 2.0 g | 379 | 9.6 | 14.6 | 10.5 | 1.9 | 61.1 | 23.9 | 2.4 | 76.0 |
| Garlic powder | Lahsun powder | Global | Central Asia | 2.0 g | 331 | 6.5 | 16.5 | 0.7 | 0.1 | 72.7 | 9.0 | 2.4 | 1193.0 |
| Ginger, ground | Adrak (sukha) | Indian – staple | India/China | 3.0 g | 335 | 9.9 | 8.9 | 4.2 | 2.1 | 71.6 | 14.1 | 3.4 | 27.0 |
| Kalonji (nigella) | Kalonji | Indian – aromatic | India | 1.0 g | 345 | 6.0 | 16.0 | 35.0 | 0.0 | 38.0 | 15.0 | 0.0 | 88.0 |
| Kashmiri chili | Kashmiri Mirch | Indian – regional | Kashmir | 3.0 g | 250 | 10.0 | 12.5 | 12.0 | 2.0 | 52.0 | 30.0 | 8.0 | 1200.0 |
| Mace, ground | Javitri | Indian – aromatic | Indonesia | 1.0 g | 475 | 8.2 | 6.7 | 32.4 | 11.2 | 50.5 | 20.2 | 0.0 | 80.0 |
| Mustard paste (yellow) | Peeli sarson paste | Condiment | US/Europe | 10.0 g | 66 | 81.3 | 4.4 | 3.3 | 0.2 | 8.1 | 3.7 | 1.6 | 1124.0 |
| Mustard seed, ground | Rai/Sarson | Indian – staple | India | 2.0 g | 469 | 5.3 | 26.1 | 28.8 | 1.5 | 28.1 | 12.2 | 3.9 | 13.0 |
| Nutmeg, ground | Jaiphal | Indian – aromatic | Indonesia | 1.0 g | 525 | 6.2 | 5.8 | 36.3 | 25.9 | 49.3 | 20.8 | 2.9 | 16.0 |
| Onion powder | Pyaz powder | Global | Central Asia | 2.0 g | 341 | 5.5 | 10.4 | 1.0 | 0.2 | 79.1 | 15.2 | 14.5 | 73.0 |
| Oregano, dried | Oregano | Global | Mediterranean | 1.0 g | 265 | 9.9 | 9.0 | 4.3 | 1.6 | 68.9 | 42.5 | 4.1 | 25.0 |
| Paprika | Paprika | Global | Hungary/Spain | 2.0 g | 282 | 11.2 | 14.1 | 12.9 | 2.1 | 53.9 | 34.9 | 10.3 | 68.0 |
| Red chili powder | Lal Mirch | Indian – staple | India/Mexico | 3.0 g | 282 | 10.0 | 13.5 | 14.3 | 2.7 | 49.7 | 34.8 | 7.7 | 1600.0 |
| Rosemary, dried | Rosemary | Global | Mediterranean | 1.0 g | 331 | 9.3 | 4.9 | 15.2 | 7.4 | 64.1 | 42.6 | 2.1 | 50.0 |
| Saffron | Kesar | Global – premium | Spain/Iran/India | 0.1 g | 310 | 11.9 | 11.4 | 5.9 | 1.6 | 65.4 | 3.9 | 0.0 | 148.0 |
| Sambar powder | Sambar powder | Indian – blend | South India | 3.0 g | 295 | 9.0 | 13.5 | 12.0 | 1.8 | 55.0 | 22.0 | 4.0 | 890.0 |
| Soy sauce | Soy sauce | Condiment | China | 15.0 g | 53 | 71.7 | 5.3 | 0.1 | 0.0 | 7.2 | 0.8 | 1.2 | 5686.0 |
| Star anise | Chakraphool | Indian – aromatic | China/India | 1.0 g | 337 | 9.5 | 17.6 | 15.9 | 0.0 | 50.0 | 14.6 | 0.0 | 16.0 |
| Tamarind paste | Imli paste | Condiment | India/Africa | 10.0 g | 239 | 31.4 | 2.8 | 0.6 | 0.3 | 62.5 | 5.1 | 57.4 | 28.0 |
| Thyme, dried | Thyme | Global | Mediterranean | 1.0 g | 276 | 7.8 | 9.1 | 7.4 | 2.1 | 63.9 | 37.0 | 1.7 | 55.0 |
| Turmeric, ground | Haldi | Indian – staple | India | 2.0 g | 354 | 11.4 | 7.8 | 9.9 | 3.1 | 64.9 | 21.1 | 3.2 | 38.0 |
| White vinegar | Safed sirka | Condiment | Global | 15.0 g | 18 | 94.8 | 0.0 | 0.0 | 0.0 | 0.0 | 0.0 | 0.0 | 2.0 |
All values per 100 g edible portion, dried/ground form unless stated. Condiments reflect as-sold diluted form. Real-world values vary ±10–20% based on variety, harvest, and processing. Sources: USDA FoodData Central SR Legacy; ICMR-NIN IFCT 2017 for Indian items.
⚠️ Sodium alert for blends and condiments: Chaat masala can reach 4200 mg sodium per 100 g. Soy sauce averages 5686 mg/100 g. At a 15 g serving, soy sauce alone contributes ~850 mg sodium — more than a third of the WHO daily limit. These entries are in the dataset precisely because tracking them matters.
Vitamin Content (per 100 g)
Spices are genuinely rich in several vitamins — particularly fat-soluble vitamins and specific B-group members. The standouts in this dataset: red chili powder contains an extraordinary 29.8 mg Vitamin E per 100 g and 2081 µg Vitamin A RAE — more than a large serving of carrots. Dried basil holds 1714 µg Vitamin K per 100 g — pharmaceutical territory. Bay leaf contributes 180 µg folate (DFE). Curry leaves are an underappreciated source of Vitamin A (1898 µg RAE) and B6 (0.93 mg). None of these values are realised from a 1 g pinch, but they are why traditional Indian cooking built them into daily cooking rather than treating them as optional garnish.
| Name (English) | Vit A RAE (mcg) | Vit C (mg) | Vit D (mcg) | Vit E (mg) | Vit K (mcg) | B1 Thiamin (mg) | B2 Riboflavin (mg) | B3 Niacin (mg) | B5 Pantoth. (mg) | B6 (mg) | B9 Folate DFE (mcg) | B12 (mcg) |
|---|---|---|---|---|---|---|---|---|---|---|---|---|
| Turmeric, ground | 0.00 | 25.90 | 0.00 | 4.43 | 13.40 | 0.15 | 0.23 | 5.14 | 0.26 | 0.11 | 36.00 | 0.00 |
| Cumin seed | 64.00 | 7.70 | 0.00 | 3.33 | 5.40 | 0.63 | 0.33 | 4.58 | 0.66 | 0.44 | 10.00 | 0.00 |
| Coriander seed | 0.00 | 21.00 | 0.00 | 2.50 | 0.00 | 0.24 | 0.29 | 2.13 | 0.12 | 0.41 | 72.00 | 0.00 |
| Black pepper, ground | 0.00 | 0.00 | 0.00 | 1.04 | 163.70 | 0.11 | 0.24 | 1.14 | 0.03 | 0.29 | 17.00 | 0.00 |
| Red chili powder | 2081.00 | 76.40 | 0.00 | 29.80 | 80.30 | 0.33 | 0.92 | 8.70 | 0.66 | 2.45 | 23.00 | 0.00 |
| Cardamom, ground | 0.00 | 21.00 | 0.00 | 0.00 | 0.00 | 0.20 | 0.23 | 1.10 | 0.00 | 0.23 | 0.00 | 0.00 |
| Fenugreek seed | 60.00 | 3.00 | 0.00 | 0.00 | 0.00 | 0.32 | 0.37 | 1.64 | 0.00 | 0.60 | 57.00 | 0.00 |
| Mustard seed, ground | 0.00 | 7.10 | 0.00 | 4.96 | 5.40 | 0.81 | 0.26 | 7.89 | 0.00 | 0.40 | 0.00 | 0.00 |
| Ginger, ground | 0.00 | 0.70 | 0.00 | 0.00 | 0.00 | 0.05 | 0.17 | 9.62 | 0.18 | 0.63 | 13.00 | 0.00 |
| Asafoetida (hing) | 0.00 | 10.00 | 0.00 | 0.00 | 0.00 | 0.04 | 0.05 | 0.50 | 0.00 | 0.04 | 5.00 | 0.00 |
| Cloves, ground | 0.00 | 0.20 | 0.00 | 8.82 | 141.80 | 0.16 | 0.27 | 1.56 | 0.51 | 0.39 | 26.00 | 0.00 |
| Cinnamon, ground | 15.00 | 3.80 | 0.00 | 2.32 | 31.20 | 0.02 | 0.04 | 1.33 | 0.36 | 0.16 | 6.00 | 0.00 |
| Nutmeg, ground | 5.00 | 3.00 | 0.00 | 0.57 | 0.00 | 0.35 | 0.06 | 1.35 | 0.35 | 0.16 | 10.00 | 0.00 |
| Mace, ground | 80.00 | 21.00 | 0.00 | 0.00 | 0.00 | 0.30 | 0.45 | 1.35 | 0.20 | 0.16 | 0.00 | 0.00 |
| Bay leaf, dried | 614.00 | 46.50 | 0.00 | 0.00 | 0.00 | 0.01 | 0.42 | 2.01 | 0.50 | 1.74 | 180.00 | 0.00 |
| Star anise | 0.00 | 21.00 | 0.00 | 0.00 | 0.00 | 0.10 | 0.29 | 2.50 | 0.00 | 0.50 | 0.00 | 0.00 |
| Fennel seed | 135.00 | 21.00 | 0.00 | 0.00 | 0.00 | 0.41 | 0.35 | 6.05 | 0.00 | 0.47 | 0.00 | 0.00 |
| Carom seed (ajwain) | 0.00 | 12.00 | 0.00 | 0.00 | 0.00 | 0.40 | 0.28 | 3.60 | 0.00 | 0.00 | 0.00 | 0.00 |
| Kalonji (nigella) | 0.00 | 0.00 | 0.00 | 0.00 | 0.00 | 0.00 | 0.00 | 0.00 | 0.00 | 0.00 | 0.00 | 0.00 |
| Curry leaves, dried | 1898.00 | 4.00 | 0.00 | 0.00 | 0.00 | 0.06 | 0.14 | 2.30 | 0.00 | 0.93 | 93.00 | 0.00 |
| Garam masala | 765.00 | 16.30 | 0.00 | 3.10 | 0.00 | 0.23 | 0.26 | 3.37 | 0.31 | 0.58 | 23.00 | 0.00 |
| Chaat masala | 500.00 | 10.00 | 0.00 | 2.00 | 0.00 | 0.20 | 0.22 | 3.00 | 0.30 | 0.50 | 20.00 | 0.00 |
| Sambar powder | 800.00 | 15.00 | 0.00 | 3.00 | 0.00 | 0.25 | 0.30 | 3.50 | 0.35 | 0.55 | 25.00 | 0.00 |
| Kashmiri chili | 2500.00 | 90.00 | 0.00 | 30.00 | 80.00 | 0.30 | 0.90 | 8.00 | 0.60 | 2.30 | 22.00 | 0.00 |
| Amchur (dry mango) | 0.00 | 0.00 | 0.00 | 0.00 | 0.00 | 0.10 | 0.03 | 0.50 | 0.00 | 0.18 | 14.00 | 0.00 |
| Garlic powder | 0.00 | 1.20 | 0.00 | 0.01 | 0.00 | 0.60 | 0.23 | 1.06 | 0.38 | 1.65 | 13.00 | 0.00 |
| Onion powder | 0.00 | 12.00 | 0.00 | 0.28 | 0.00 | 0.50 | 0.05 | 0.58 | 0.47 | 1.18 | 77.00 | 0.00 |
| Paprika | 6042.00 | 0.90 | 0.00 | 29.10 | 0.00 | 0.33 | 0.98 | 10.10 | 0.66 | 2.51 | 49.00 | 0.00 |
| Curry powder | 2786.00 | 7.00 | 0.00 | 29.00 | 0.00 | 0.30 | 0.27 | 3.80 | 0.37 | 0.42 | 35.00 | 0.00 |
| Mustard paste (yellow) | 0.00 | 0.00 | 0.00 | 0.60 | 0.00 | 0.11 | 0.06 | 0.63 | 0.00 | 0.14 | 18.00 | 0.00 |
| Soy sauce | 0.00 | 0.00 | 0.00 | 0.00 | 0.00 | 0.05 | 0.18 | 4.27 | 0.00 | 0.22 | 18.00 | 0.00 |
| White vinegar | 0.00 | 0.00 | 0.00 | 0.00 | 0.00 | 0.00 | 0.00 | 0.00 | 0.00 | 0.00 | 0.00 | 0.00 |
| Apple cider vinegar | 0.00 | 0.00 | 0.00 | 0.00 | 0.00 | 0.00 | 0.00 | 0.00 | 0.00 | 0.00 | 0.00 | 0.00 |
| Tamarind paste | 0.00 | 3.50 | 0.00 | 0.00 | 0.00 | 0.43 | 0.15 | 1.94 | 0.14 | 0.07 | 14.00 | 0.00 |
| Coconut milk (canned) | 0.00 | 2.80 | 0.00 | 0.00 | 0.00 | 0.03 | 0.00 | 0.76 | 0.26 | 0.03 | 16.00 | 0.00 |
| Oregano, dried | 130.00 | 2.30 | 0.00 | 18.30 | 621.70 | 0.18 | 0.53 | 4.64 | 0.47 | 1.04 | 274.00 | 0.00 |
| Basil, dried | 744.00 | 61.20 | 0.00 | 10.70 | 1714.50 | 0.08 | 0.32 | 4.43 | 0.34 | 1.10 | 310.00 | 0.00 |
| Thyme, dried | 238.00 | 160.10 | 0.00 | 0.00 | 1714.50 | 0.05 | 0.10 | 1.82 | 0.14 | 0.55 | 274.00 | 0.00 |
| Rosemary, dried | 146.00 | 61.20 | 0.00 | 2.26 | 0.00 | 0.51 | 0.43 | 1.00 | 0.79 | 1.74 | 307.00 | 0.00 |
| Saffron | 27.00 | 80.80 | 0.00 | 1.03 | 0.00 | 0.12 | 0.27 | 1.46 | 0.00 | 1.01 | 93.00 | 0.00 |
0 = below detection limit or not detected.
Mineral Content (per 100 g)
The mineral data for spices routinely surprises people who encounter it for the first time. Dried basil contains 2113 mg calcium per 100 g — more than double the calcium in milk by weight. Cumin contributes 66.4 mg iron per 100 g. Thyme delivers 123.6 mg iron — the highest in the dataset. These numbers reflect dry weight concentration; a realistic serving of 1–2 g provides a fraction of this. But for populations using spices generously across multiple meals daily, cumulative mineral contribution is not negligible, and the anti-phytate effect of fermentation and cooking in acidic environments (tamarind, lemon) genuinely improves what is absorbed.
| Name (English) | Ca (mg) | Fe (mg) | Mg (mg) | P (mg) | K (mg) | Na (mg) | Zn (mg) | Cu (mg) | Mn (mg) | Se (mcg) |
|---|---|---|---|---|---|---|---|---|---|---|
| Turmeric, ground | 183.0 | 47.5 | 193.0 | 268.0 | 2080.0 | 38.0 | 4.4 | 0.6 | 7.8 | 4.4 |
| Cumin seed | 931.0 | 66.4 | 366.0 | 499.0 | 1788.0 | 168.0 | 4.8 | 0.9 | 3.3 | 5.2 |
| Coriander seed | 709.0 | 16.3 | 330.0 | 409.0 | 1267.0 | 35.0 | 4.7 | 1.0 | 1.9 | 0.9 |
| Black pepper, ground | 443.0 | 28.9 | 194.0 | 158.0 | 1329.0 | 20.0 | 1.4 | 1.3 | 12.8 | 3.1 |
| Red chili powder | 148.0 | 34.3 | 152.0 | 293.0 | 2027.0 | 1600.0 | 2.5 | 0.4 | 2.0 | 8.8 |
| Cardamom, ground | 383.0 | 13.9 | 229.0 | 178.0 | 1119.0 | 18.0 | 7.5 | 0.4 | 28.0 | 0.3 |
| Fenugreek seed | 176.0 | 33.5 | 191.0 | 296.0 | 770.0 | 67.0 | 2.5 | 1.1 | 1.2 | 6.3 |
| Mustard seed, ground | 266.0 | 9.2 | 238.0 | 828.0 | 738.0 | 13.0 | 3.1 | 0.5 | 2.5 | 208.0 |
| Ginger, ground | 116.0 | 19.8 | 214.0 | 184.0 | 1320.0 | 27.0 | 3.6 | 0.5 | 33.3 | 55.0 |
| Asafoetida (hing) | 130.0 | 39.4 | 100.0 | 50.0 | 1200.0 | 76.0 | 0.5 | 0.4 | 0.5 | 0.0 |
| Cloves, ground | 632.0 | 11.8 | 264.0 | 104.0 | 1102.0 | 277.0 | 2.3 | 0.4 | 60.1 | 5.9 |
| Cinnamon, ground | 1002.0 | 8.3 | 60.0 | 64.0 | 431.0 | 10.0 | 1.8 | 0.3 | 17.5 | 3.1 |
| Nutmeg, ground | 184.0 | 3.0 | 183.0 | 213.0 | 350.0 | 16.0 | 2.2 | 1.0 | 2.9 | 1.6 |
| Mace, ground | 252.0 | 13.9 | 163.0 | 110.0 | 463.0 | 80.0 | 2.1 | 2.5 | 2.6 | 3.9 |
| Bay leaf, dried | 834.0 | 43.0 | 120.0 | 113.0 | 529.0 | 23.0 | 3.7 | 1.3 | 77.3 | 2.8 |
| Star anise | 646.0 | 21.7 | 153.0 | 440.0 | 1440.0 | 16.0 | 5.3 | 1.0 | 21.6 | 5.0 |
| Fennel seed | 1196.0 | 18.5 | 385.0 | 487.0 | 1694.0 | 88.0 | 3.7 | 1.1 | 6.5 | 3.3 |
| Carom seed (ajwain) | 667.0 | 16.0 | 258.0 | 333.0 | 1333.0 | 10.0 | 3.0 | 0.8 | 5.0 | 3.0 |
| Kalonji (nigella) | 931.0 | 66.4 | 366.0 | 499.0 | 1788.0 | 88.0 | 5.0 | 1.8 | 2.5 | 12.0 |
| Curry leaves, dried | 830.0 | 7.0 | 44.0 | 102.0 | 883.0 | 12.0 | 0.2 | 0.1 | 2.1 | 0.0 |
| Garam masala | 260.0 | 33.0 | 170.0 | 200.0 | 1200.0 | 76.0 | 2.5 | 0.6 | 5.8 | 4.0 |
| Chaat masala | 200.0 | 12.0 | 100.0 | 150.0 | 900.0 | 4200.0 | 1.5 | 0.4 | 3.0 | 3.0 |
| Sambar powder | 250.0 | 20.0 | 140.0 | 180.0 | 950.0 | 890.0 | 2.0 | 0.6 | 4.5 | 4.0 |
| Kashmiri chili | 120.0 | 30.0 | 140.0 | 270.0 | 1800.0 | 1200.0 | 2.2 | 0.4 | 1.9 | 8.0 |
| Amchur (dry mango) | 114.0 | 2.5 | 54.0 | 108.0 | 1190.0 | 23.0 | 0.5 | 0.2 | 0.4 | 0.0 |
| Garlic powder | 79.0 | 2.3 | 25.0 | 356.0 | 1193.0 | 26.0 | 1.3 | 0.2 | 0.9 | 14.2 |
| Onion powder | 325.0 | 3.9 | 78.0 | 300.0 | 985.0 | 73.0 | 1.1 | 0.2 | 1.2 | 1.3 |
| Paprika | 229.0 | 21.1 | 178.0 | 314.0 | 2280.0 | 68.0 | 4.3 | 0.4 | 1.6 | 6.3 |
| Curry powder | 478.0 | 29.6 | 254.0 | 349.0 | 1543.0 | 52.0 | 3.1 | 0.5 | 5.3 | 5.4 |
| Mustard paste (yellow) | 77.0 | 1.7 | 47.0 | 102.0 | 152.0 | 1124.0 | 0.8 | 0.1 | 0.4 | 28.9 |
| Soy sauce | 22.0 | 2.4 | 40.0 | 130.0 | 214.0 | 5686.0 | 0.4 | 0.1 | 0.3 | 1.0 |
| White vinegar | 7.0 | 0.0 | 1.0 | 4.0 | 2.0 | 2.0 | 0.0 | 0.0 | 0.1 | 0.0 |
| Apple cider vinegar | 7.0 | 0.0 | 5.0 | 8.0 | 73.0 | 5.0 | 0.0 | 0.0 | 0.3 | 0.0 |
| Tamarind paste | 113.0 | 2.8 | 92.0 | 113.0 | 628.0 | 28.0 | 0.1 | 0.1 | 0.9 | 1.4 |
| Coconut milk (canned) | 18.0 | 3.3 | 37.0 | 100.0 | 263.0 | 15.0 | 0.7 | 0.3 | 0.9 | 2.5 |
| Oregano, dried | 1597.0 | 36.8 | 270.0 | 148.0 | 1669.0 | 25.0 | 2.7 | 0.6 | 5.0 | 4.5 |
| Basil, dried | 2113.0 | 52.7 | 711.0 | 274.0 | 2630.0 | 76.0 | 1.7 | 1.7 | 9.8 | 0.3 |
| Thyme, dried | 1890.0 | 123.6 | 220.0 | 201.0 | 814.0 | 55.0 | 1.8 | 0.9 | 7.9 | 45.2 |
| Rosemary, dried | 1280.0 | 29.3 | 220.0 | 70.0 | 955.0 | 50.0 | 3.2 | 0.4 | 5.0 | 1.1 |
| Saffron | 111.0 | 11.1 | 264.0 | 252.0 | 1724.0 | 148.0 | 1.1 | 0.3 | 28.4 | 5.6 |
Phytochemicals — The Hidden Actives
Beyond macros and micronutrients, spices contain a category of compounds that don’t appear in standard nutrition databases at all: phytochemicals. These are biologically active molecules produced by the plant — often as defence mechanisms — that have measurable effects in the human body. Unlike vitamins and minerals, they are not classified as essential nutrients, but the research literature on their effects is large and growing. The table below lists the primary bioactive for each spice, its approximate concentration, and a plain-language note on its mechanism and evidence quality.
| Spice / Condiment | Primary Phytochemical | Approx. Amount (mg/100g) | Mechanism / Notes |
|---|---|---|---|
| Turmeric | Curcumin | ~3000 | NF-κB inhibitor; anti-inflammatory. Bioavailability very low without piperine co-administration. |
| Black pepper | Piperine | ~62 | Inhibits CYP3A4; raises curcumin bioavailability by ~2000%. Thermogenic via TRPV1. |
| Ginger | Gingerols / Shogaols | ~600 | Anti-nausea (well-supported RCT evidence). Gingerols convert to shogaols on drying/heating. |
| Fenugreek | 4-Hydroxyisoleucine | ~350 | Amino acid unique to fenugreek; stimulates insulin secretion. Hypoglycaemic human trial evidence exists. |
| Cardamom | 1,8-Cineole | ~400 | Major volatile oil component; digestive, expectorant. Breath-freshening activity well established. |
| Cumin | Thymoquinone (trace) / Cuminaldehyde | ~1200 | Antioxidant; carminative. Cuminaldehyde drives the characteristic aroma and digestive action. |
| Cloves | Eugenol | ~15000 | 72–90% of clove volatile oil. Antiseptic, local anaesthetic. Used in dental applications worldwide. |
| Cinnamon | Cinnamaldehyde | ~10000 | Improves insulin sensitivity; antifungal. Note: cassia variety has high coumarin — problematic in large daily doses. |
| Ajwain (carom) | Thymol | ~5000 | Potent antimicrobial; disrupts microbial membranes. Active ingredient in many antiseptic preparations. |
| Kalonji (nigella) | Thymoquinone | ~3000 | Anti-diabetic, anti-inflammatory. Growing clinical evidence base; ~0.5–1% of seed weight. |
| Asafoetida (hing) | Ferulic acid / Umbelliferone | ~200 | Enzyme inhibitor responsible for characteristic pungency. Anticonvulsant and antispasmodic in animal models. |
| Garlic powder | Allicin | ~900 (precursor) | Organosulfur compound; cardiovascular benefit. Only formed when alliin meets alliinase — i.e., on crushing/cutting. |
| Paprika | Capsanthin / Capsorubin | ~15000 | Carotenoid pigments; high antioxidant capacity. Different from capsaicin — paprika is mostly non-pungent. |
| Oregano | Rosmarinic acid / Carvacrol | ~5000 | Antimicrobial; one of the most potent antifungal herbs. Oregano oil standardised for carvacrol content. |
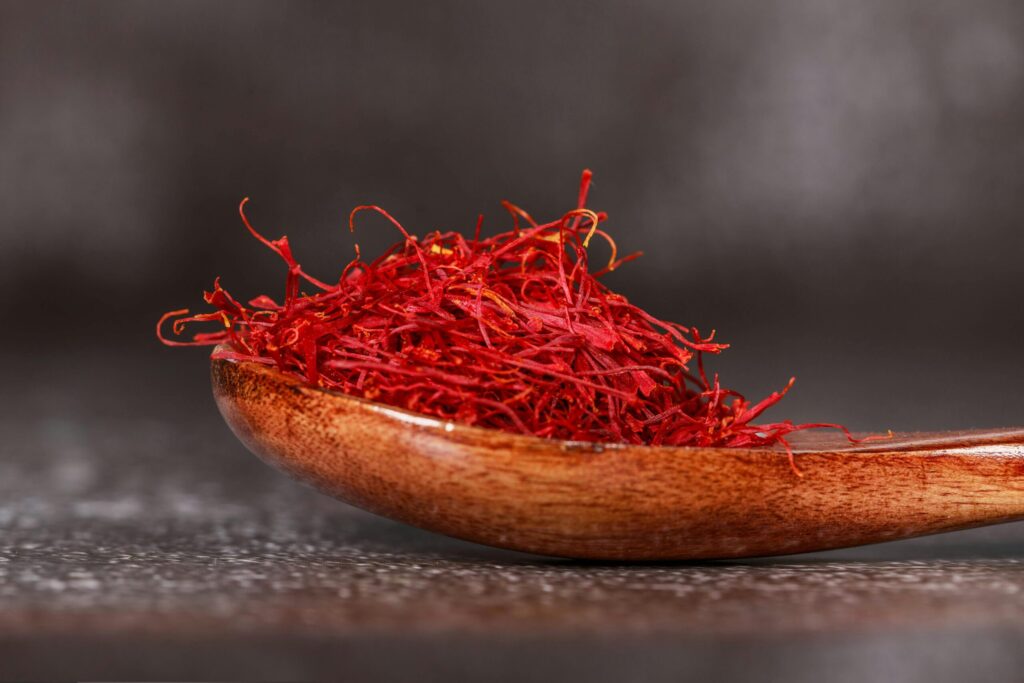
| Saffron | Safranal / Crocin | ~20000 (crocin) | Mood modulation; RCT evidence for mild antidepressant effect comparable to low-dose SSRIs at 30 mg/day extracts. |
| Tamarind paste | Hydroxycitric acid (HCA) | ~200 | ATP-citrate lyase inhibitor; popular weight-loss supplement. Clinical evidence modest and mixed. |
| Coconut milk | Lauric acid (MCT) | ~47000 | Medium-chain saturated fat; metabolised differently from long-chain fats. ~60% of coconut fat is lauric acid. |
Concentrations are approximate and vary with variety, growing conditions, and processing. These compounds are not classified as essential nutrients and should not be read as therapeutic claims.
Indian Spice Spotlight — 6 Deep Dives
Six spices that are either nutritionally exceptional, globally underrepresented in databases, or frequently misunderstood — with the full nutrient picture and a note on what the research actually says.
Turmeric (Haldi)
Curcuma longa
Fenugreek (Methi Dana)
Trigonella foenum-graecum
Kalonji (Nigella / Black Seed)
Nigella sativa
Curry Leaves (Kari Patta)
Murraya koenigii
Ajwain (Carom Seed)
Trachyspermum ammi
Saffron (Kesar)
Crocus sativus
Myths & Facts of Spices & Condiments
“Turmeric is a superfood you should take as a supplement.”
Turmeric’s curcumin has ≤1% oral bioavailability on its own. Supplements without piperine are largely wasted. The traditional combination of turmeric + black pepper + fat in cooking achieves far better absorption than an isolated capsule.
“Spices contribute no meaningful nutrition because you use such small amounts.”
For individual nutrients, a single pinch is modest. But Indian cooking uses 5–10 spices across 3 meals daily. The cumulative mineral, fibre, and phytochemical contribution is measurable and nutritionally significant at population level.
“Cinnamon cures diabetes.”
Cinnamaldehyde has documented insulin-sensitising effects in small trials. The effect is modest and not a replacement for diabetes management. Additionally, common “cinnamon” sold in India is often cassia (high coumarin), which is hepatotoxic at daily supplement doses. Ceylon cinnamon is safer for regular use.
“Spices are high in sodium so they increase blood pressure.”
Pure spices like turmeric, cumin, and cardamom have negligible sodium (10–40 mg/100 g) and 2–3 g actual use. The sodium problem is in spice blends and condiments: chaat masala (4200 mg/100 g), soy sauce (5686 mg/100 g). Read the label and track blends carefully.
“Red chili powder is nutritionally empty — it’s just heat.”
Red chili is one of the most micronutrient-dense spices in this database: 2081 µg Vitamin A, 29.8 mg Vitamin E, 76.4 mg Vitamin C, 34.3 mg iron, and 2027 mg potassium per 100 g. At 3 g use per meal across 3 meals, it contributes meaningfully to daily micronutrient intake.
Frequently Asked Questions (FAQs)
Should I use spice nutrient values per 100 g or per serving for diet tracking?
Always store values per 100 g as your base — this is the standard used by USDA, ICMR-NIN, and all major food databases. It lets you compare spices to each other and to other foods on equal terms. For actual tracking, multiply the per-100 g value by the grams you used, then divide by 100.
Why does cumin show 66 mg iron per 100 g but it's not considered an iron food?
Bioavailability. The iron in cumin is entirely non-haem iron, which is absorbed at 2–20% efficiency compared to haem iron from meat at 15–35%. At a realistic 2 g serving, cumin provides about 1.3 mg iron — meaningful but not equivalent to meat. Consuming it alongside Vitamin C (lemon juice) and avoiding tea or coffee within 30 minutes can improve absorption by 2–3×.
Do dried spices have the same nutrient values as fresh?
No — and this matters for Vitamin C in particular. Fresh ginger contains ~5 mg Vitamin C per 100 g; dried ginger powder contains only ~0.7 mg. Drying concentrates minerals and fibre (values go up per 100 g) but degrades heat-sensitive vitamins like Vitamin C. Most figures in this database reflect the dried, ground form, which is how the majority of Indian spices are consumed.
What is the difference between Kashmiri chili and regular red chili powder nutritionally?
Kashmiri chili has significantly more Vitamin A (2500 µg RAE vs 2081 µg for regular red chili) and more capsanthin/capsorubin pigments (ASTA colour value above 100). It is milder in capsaicin — producing less heat — but more intensely coloured. For tracking purposes, they are broadly similar in macros but Kashmiri chili is slightly richer in fat-soluble antioxidants.
Data Sources & References
- USDA FoodData Central SR Legacy (fdc.nal.usda.gov)
- ICMR-NIN Indian Food Composition Tables 2017
- Phytochemical values from PubMed peer-reviewed literature and USDA Expanded Flavonoid Database
All values per 100 g edible portion, ground/dried form unless stated · Real-world values vary ±10–20% based on variety, harvest, and processing.