Every Nutrient in
Every Beverage, Explained
Four master tables cover all 40 beverages — macronutrients, vitamins, minerals, and bioactive compounds — with full data from IFCT 2017, USDA FoodData Central, and Phenol-Explorer. Category-by-category nutritional analysis follows each table group.
1–110
kcal / 100 ml
Energy Range
Tea 1 kcal → Thandai 110 kcal
40
beverages
Full Dataset
7 categories, Indian & International
7,860
µmol TE/100ml
Highest ORAC
Espresso – dataset leader in antioxidant capacity
250
mg K/100 ml
Highest Potassium
Coconut Water – 125× more than cola
9,000
µg lycopene
Tomato Juice
Highest lycopene — only significant source in dataset
Our Beverages Nutrition Facts database provides a comprehensive look at the world’s most popular daily drinks. This guide features dozens of detailed profiles, offering an exact breakdown of the macros and micronutrients in beverages for every item listed. By exploring these Beverages Nutrition Facts, you can effortlessly track the calories in global and Indian drinks, from your morning black coffee to a refreshing afternoon buttermilk. Whether you are researching the nutritional value of tea coffee and lassi or navigating our healthy summer beverages database, these Beverages Nutrition Facts deliver the precise data required to optimize your daily liquid intake.
Beverages are the most nutritionally misread food category in the Indian diet. A cup of masala chai and a can of cola look like similar volumes — but across five nutritional tables they differ by 170 mg calcium, 0.18 µg B12, 85 mg potassium, 80 mg polyphenols, and an antioxidant gap of 1,118 ORAC units. Understanding what is actually in each glass requires examining all five nutritional dimensions: macros, serving-scaled macros, vitamins, minerals, and bioactives.
This article presents data for 40 beverages across 7 categories from three authoritative sources: IFCT 2017 (NIN-ICMR Hyderabad, primary source for Indian beverages); USDA FoodData Central SR Legacy & Foundation Foods (international beverages); and Phenol-Explorer v3.6 (polyphenols, catechins, EGCG, ORAC). All per-100-ml values allow direct comparison; Table 2 scales to standard serving sizes so you can see real dietary impact.
Macronutrient Composition per 100 ml
Per 100 ml ready-to-drink. This table is the foundation for caloric density and structural value comparison. Energy spans 1–110 kcal/100 ml. Protein is 0 g in almost all non-dairy, non-plant-milk beverages.
Table 1: Macronutrients per 100 ml
| Beverage | Category | Region | Energy (kcal) | Protein (g) | Total Fat (g) | Carbohydrates (g) | Total Sugar (g) | Dietary Fiber (g) | Water (g) |
|---|---|---|---|---|---|---|---|---|---|
| Whole Cow's Milk | Dairy-Based | Indian/International | 61 | 3.2 | 3.4 | 4.7 | 4.7 | 0 | 88 |
| Toned Milk (2.5% fat) | Dairy-Based | Indian | 50 | 3.2 | 2.5 | 4.8 | 4.8 | 0 | 89 |
| Skim Milk (0.1% fat) | Dairy-Based | International | 35 | 3.4 | 0.1 | 4.9 | 4.9 | 0 | 91 |
| Buttermilk (Chaas, salted) | Dairy-Based | Indian | 40 | 3.5 | 1 | 4.8 | 4.5 | 0 | 90 |
| Sweet Lassi | Dairy-Based | Indian | 80 | 3.5 | 2.5 | 12 | 11.5 | 0 | 81 |
| Badam Milk (almond milk beverage) | Dairy-Based | Indian | 95 | 3.2 | 3.8 | 12 | 11 | 0.2 | 78 |
| Flavored Milk (chocolate) | Dairy-Based | International | 75 | 3.4 | 2.5 | 11 | 10.5 | 0.3 | 82 |
| Orange Juice (fresh squeezed) | Fruit Juices | International | 45 | 0.7 | 0.2 | 10.4 | 8.4 | 0.2 | 88.3 |
| Apple Juice (commercial, 100%) | Fruit Juices | International | 46 | 0.1 | 0.1 | 11.3 | 10.9 | 0.2 | 88.2 |
| Mango Juice/Nectar | Fruit Juices | Indian/International | 60 | 0.4 | 0.1 | 14.5 | 12.5 | 0.5 | 85 |
| Pomegranate Juice (100%) | Fruit Juices | International | 54 | 0.2 | 0.3 | 13.1 | 9.8 | 0.1 | 85.9 |
| Tomato Juice (unsalted) | Fruit Juices | International | 17 | 0.9 | 0.1 | 3.5 | 2.6 | 0.4 | 94.5 |
| Mixed Fruit Juice (commercial) | Fruit Juices | Indian | 55 | 0.3 | 0.1 | 13.5 | 11 | 0.3 | 85.8 |
| Sports Drink (Electrolyte) | Functional & Energy Drinks | International | 26 | 0 | 0 | 6.4 | 5.3 | 0 | 93.6 |
| Energy Drink (standard) | Functional & Energy Drinks | International | 45 | 0 | 0 | 11 | 11 | 0 | 89 |
| ORS Solution (WHO formula) | Functional & Energy Drinks | International | 13 | 0 | 0 | 3.2 | 0 | 0 | 96.8 |
| Black Tea (brewed, unsweetened) | Hot Beverages | Indian/International | 1 | 0 | 0 | 0.3 | 0 | 0 | 99.7 |
| Masala Chai (with milk & sugar) | Hot Beverages | Indian | 65 | 2.4 | 2.1 | 10 | 9.5 | 0 | 84.8 |
| Green Tea (brewed, unsweetened) | Hot Beverages | Indian/International | 1 | 0 | 0 | 0.2 | 0 | 0 | 99.8 |
| Instant Coffee (black, unsweetened) | Hot Beverages | International | 2 | 0.3 | 0 | 0 | 0 | 0 | 99.6 |
| Filter Coffee (with milk & sugar) | Hot Beverages | Indian (South) | 75 | 2.2 | 2.5 | 10.8 | 10 | 0 | 84 |
| Espresso | Hot Beverages | International | 9 | 0.1 | 0.2 | 1.7 | 0 | 0 | 94 |
| Cappuccino (whole milk) | Hot Beverages | International | 74 | 4.2 | 3.8 | 6 | 5.5 | 0 | 85 |
| Hot Chocolate (whole milk) | Hot Beverages | International | 80 | 3.2 | 2.6 | 12 | 11.5 | 0.3 | 80 |
| Kahwa (Kashmiri Green Tea) | Hot Beverages | Indian | 8 | 0.1 | 0.1 | 1.6 | 1.2 | 0 | 97.5 |
| Soy Milk (unsweetened) | Plant-Based Beverages | International | 33 | 3.3 | 1.8 | 1.8 | 1 | 0.4 | 92.7 |
| Almond Milk (commercial, unsweet.) | Plant-Based Beverages | International | 15 | 0.6 | 1.1 | 0.6 | 0 | 0.4 | 97.5 |
| Oat Milk (commercial) | Plant-Based Beverages | International | 46 | 1 | 1.5 | 7 | 4 | 0.5 | 89.5 |
| Cola (regular) | Soft Drinks / Carbonated | International | 42 | 0 | 0 | 10.6 | 10.6 | 0 | 89.4 |
| Lemon-Lime Soda (regular) | Soft Drinks / Carbonated | International | 42 | 0 | 0 | 10.9 | 10.9 | 0 | 89.1 |
| Ginger Ale | Soft Drinks / Carbonated | International | 34 | 0 | 0 | 8.8 | 8.8 | 0 | 91.2 |
| Limca / Lemon Soda (Indian) | Soft Drinks / Carbonated | Indian | 38 | 0 | 0 | 9.5 | 9.5 | 0 | 90.5 |
| Nimbu Pani (Lemon Water, sweetened) | Traditional Indian | Indian | 35 | 0.1 | 0 | 9 | 8.5 | 0.1 | 90.5 |
| Aam Panna (Raw Mango Drink) | Traditional Indian | Indian | 45 | 0.3 | 0.1 | 11 | 10 | 0.4 | 88 |
| Kokum Sherbet | Traditional Indian | Indian (Western) | 48 | 0.2 | 0.1 | 12 | 11.5 | 0.5 | 87 |
| Thandai | Traditional Indian | Indian | 110 | 3 | 4.5 | 13.5 | 12.5 | 0.3 | 76 |
| Jal Jeera | Traditional Indian | Indian | 30 | 0.2 | 0.1 | 7.5 | 6.5 | 0.2 | 91.5 |
| Rose Sherbet (Rooh Afza style) | Traditional Indian | Indian | 52 | 0 | 0 | 13 | 12.8 | 0 | 86.5 |
| Sugarcane Juice (fresh) | Traditional Indian | Indian | 73 | 0.2 | 0.1 | 17.5 | 15.9 | 0 | 82 |
| Coconut Water (tender) | Traditional Indian | Indian/International | 19 | 0.7 | 0.2 | 3.7 | 2.6 | 1.1 | 95 |
Energy (kcal/100 ml)
- Highest: Thandai 110, Badam Milk 95, Hot Chocolate 80, Lassi 80
- Lowest (non-zero): Black Tea & Green Tea 1, Almond Milk 15, Coconut Water 19
Protein (g/100 ml)
- Dairy leads: Cappuccino 4.2, Chaas/Lassi 3.5, Skim Milk 3.4, Soy Milk 3.3
- All juices, teas, soft drinks: 0.0–0.3 g
Sugar Alert (g/100 ml)
- Highest: Sugarcane 15.9, Rose Sherbet 12.8, Lemon-Lime Soda 10.9, Cola 10.6
- Lowest natural-sweet: Coconut Water 2.6 g
Macronutrient Composition per Standard Serving
Per standard serving — the amount you actually drink. Serving sizes reflect Indian and international norms: espresso = 30 ml, filter coffee = 150 ml, whole milk = 250 ml, sports drink = 500 ml, cola can = 355 ml. This table converts per-100-ml comparisons into real dietary impact. A 355-ml cola can delivers 38.7 g free sugar — exceeding WHO’s 25 g/day free-sugar guidance in a single drink.
Table 2: Macronutrients per Standard Serving
| Beverage | Category | Serving (ml) | Energy (kcal) | Protein (g) | Total Fat (g) | Carbs (g) | Sugar (g) | Fiber (g) | Water (g) |
|---|---|---|---|---|---|---|---|---|---|
| Thandai | Traditional Indian | 200 | 220 | 6 | 9 | 27 | 25 | 0.6 | 152 |
| Sweet Lassi | Dairy-Based | 250 | 200 | 8.8 | 6.2 | 30 | 28.8 | 0 | 202.5 |
| Hot Chocolate (whole milk) | Hot Beverages | 240 | 192 | 7.7 | 6.2 | 28.8 | 27.6 | 0.7 | 192 |
| Badam Milk (almond milk beverage) | Dairy-Based | 200 | 190 | 6.4 | 7.6 | 24 | 22 | 0.4 | 156 |
| Flavored Milk (chocolate) | Dairy-Based | 250 | 187.5 | 8.5 | 6.2 | 27.5 | 26.2 | 0.8 | 205 |
| Sugarcane Juice (fresh) | Traditional Indian | 240 | 175.2 | 0.5 | 0.2 | 42 | 38.2 | 0 | 196.8 |
| Whole Cow's Milk | Dairy-Based | 250 | 152.5 | 8 | 8.5 | 11.8 | 11.8 | 0 | 220 |
| Cola (regular) | Soft Drinks / Carbonated | 355 | 149.1 | 0 | 0 | 37.6 | 37.6 | 0 | 317.4 |
| Lemon-Lime Soda (regular) | Soft Drinks / Carbonated | 355 | 149.1 | 0 | 0 | 38.7 | 38.7 | 0 | 316.3 |
| Cappuccino (whole milk) | Hot Beverages | 180 | 133.2 | 7.6 | 6.8 | 10.8 | 9.9 | 0 | 153 |
| Masala Chai (with milk & sugar) | Hot Beverages | 200 | 130 | 4.8 | 4.2 | 20 | 19 | 0 | 169.6 |
| Sports Drink (Electrolyte) | Functional & Energy Drinks | 500 | 130 | 0 | 0 | 32 | 26.5 | 0 | 468 |
| Pomegranate Juice (100%) | Fruit Juices | 240 | 129.6 | 0.5 | 0.7 | 31.4 | 23.5 | 0.2 | 206.2 |
| Toned Milk (2.5% fat) | Dairy-Based | 250 | 125 | 8 | 6.2 | 12 | 12 | 0 | 222.5 |
| Ginger Ale | Soft Drinks / Carbonated | 355 | 120.7 | 0 | 0 | 31.2 | 31.2 | 0 | 323.8 |
| Mango Juice/Nectar | Fruit Juices | 200 | 120 | 0.8 | 0.2 | 29 | 25 | 1 | 170 |
| Limca / Lemon Soda (Indian) | Soft Drinks / Carbonated | 300 | 114 | 0 | 0 | 28.5 | 28.5 | 0 | 271.5 |
| Filter Coffee (with milk & sugar) | Hot Beverages | 150 | 112.5 | 3.3 | 3.8 | 16.2 | 15 | 0 | 126 |
| Energy Drink (standard) | Functional & Energy Drinks | 250 | 112.5 | 0 | 0 | 27.5 | 27.5 | 0 | 222.5 |
| Apple Juice (commercial, 100%) | Fruit Juices | 240 | 110.4 | 0.2 | 0.2 | 27.1 | 26.2 | 0.5 | 211.7 |
| Oat Milk (commercial) | Plant-Based Beverages | 240 | 110.4 | 2.4 | 3.6 | 16.8 | 9.6 | 1.2 | 214.8 |
| Mixed Fruit Juice (commercial) | Fruit Juices | 200 | 110 | 0.6 | 0.2 | 27 | 22 | 0.6 | 171.6 |
| Orange Juice (fresh squeezed) | Fruit Juices | 240 | 108 | 1.7 | 0.5 | 25 | 20.2 | 0.5 | 211.9 |
| Rose Sherbet (Rooh Afza style) | Traditional Indian | 200 | 104 | 0 | 0 | 26 | 25.6 | 0 | 173 |
| Kokum Sherbet | Traditional Indian | 200 | 96 | 0.4 | 0.2 | 24 | 23 | 1 | 174 |
| Aam Panna (Raw Mango Drink) | Traditional Indian | 200 | 90 | 0.6 | 0.2 | 22 | 20 | 0.8 | 176 |
| Skim Milk (0.1% fat) | Dairy-Based | 250 | 87.5 | 8.5 | 0.2 | 12.2 | 12.2 | 0 | 227.5 |
| Nimbu Pani (Lemon Water, sweetened) | Traditional Indian | 250 | 87.5 | 0.2 | 0 | 22.5 | 21.2 | 0.2 | 226.2 |
| Buttermilk (Chaas, salted) | Dairy-Based | 200 | 80 | 7 | 2 | 9.6 | 9 | 0 | 180 |
| Soy Milk (unsweetened) | Plant-Based Beverages | 240 | 79.2 | 7.9 | 4.3 | 4.3 | 2.4 | 1 | 222.5 |
| Jal Jeera | Traditional Indian | 200 | 60 | 0.4 | 0.2 | 15 | 13 | 0.4 | 183 |
| Coconut Water (tender) | Traditional Indian | 240 | 45.6 | 1.7 | 0.5 | 8.9 | 6.2 | 2.6 | 228 |
| Tomato Juice (unsalted) | Fruit Juices | 240 | 40.8 | 2.2 | 0.2 | 8.4 | 6.2 | 1 | 226.8 |
| Almond Milk (commercial, unsweet.) | Plant-Based Beverages | 240 | 36 | 1.4 | 2.6 | 1.4 | 0 | 1 | 234 |
| ORS Solution (WHO formula) | Functional & Energy Drinks | 200 | 26 | 0 | 0 | 6.4 | 0 | 0 | 193.6 |
| Kahwa (Kashmiri Green Tea) | Hot Beverages | 200 | 16 | 0.2 | 0.2 | 3.2 | 2.4 | 0 | 195 |
| Instant Coffee (black, unsweetened) | Hot Beverages | 237 | 4.7 | 0.7 | 0 | 0 | 0 | 0 | 236.1 |
| Espresso | Hot Beverages | 30 | 2.7 | 0 | 0.1 | 0.5 | 0 | 0 | 28.2 |
| Black Tea (brewed, unsweetened) | Hot Beverages | 240 | 2.4 | 0 | 0 | 0.7 | 0 | 0 | 239.3 |
| Green Tea (brewed, unsweetened) | Hot Beverages | 240 | 2.4 | 0 | 0 | 0.5 | 0 | 0 | 239.5 |
Highest Energy / Serving
- Thandai 200ml = 220 kcal
- Sweet Lassi 250ml = 200 kcal; Badam Milk 200ml = 190 kcal
- Hot Chocolate 240ml = 192 kcal
Sugar per Serving (WHO limit 25 g/day)
- Lemon-Lime Soda 355ml → 38.7 g ⚠
- Sugarcane Juice 240ml → 38.2 g ⚠
- Cola 355ml → 37.6 g ⚠
- Sweet Lassi 250ml → 28.8 g | Coconut Water 240ml → 6.2 g ✓
Best Protein per Serving
- Sweet Lassi 250ml = 8.8 g; Skim Milk = 8.5 g
- Whole/Toned Milk 250ml = 8.0 g; Soy Milk 240ml = 7.9 g
- Chaas 200ml = 7.0 g at only 80 kcal — best ratio
Complete Vitamin Profile per 100 ml — All 13 Vitamins
Per 100 ml. Water-soluble vitamins (B-complex, C) appear in teas, coffees, juices, and traditional Indian drinks. Fat-soluble vitamins (A, D, E, K) are present only in dairy and fat-containing beverages. All 4 soft drinks record zero across every column. The most nutritionally critical values: B12 in dairy (unique source for India’s vegetarian population), vitamin C in orange juice and nimbu pani, folate in orange juice, and vitamin E in almond milk and badam milk.
Table 3: Vitamins per 100 ml
| Beverage | Category | B1 Thiamine (mg) | B2 Riboflavin (mg) | B3 Niacin (mg) | B5 Pantothenic (mg) | B6 (mg) | B7 Biotin (µg) | B9 Folate (µg) | B12 (µg) | Vit C (mg) | Vit A (µg RAE) | Vit D (µg) | Vit E (mg) | Vit K (µg) |
|---|---|---|---|---|---|---|---|---|---|---|---|---|---|---|
| Whole Cow's Milk | Dairy-Based | 0.04 | 0.18 | 0.08 | 0.31 | 0.04 | 1.8 | 11 | 0.44 | 0.9 | 46 | 0.1 | 0.1 | 0.3 |
| Toned Milk (2.5% fat) | Dairy-Based | 0.04 | 0.18 | 0.08 | 0.31 | 0.04 | 1.8 | 11 | 0.44 | 0.9 | 28 | 0.1 | 0.1 | 0.3 |
| Skim Milk (0.1% fat) | Dairy-Based | 0.04 | 0.18 | 0.09 | 0.32 | 0.04 | 2 | 12 | 0.45 | 1 | 7 | 0 | 0 | 0 |
| Buttermilk (Chaas, salted) | Dairy-Based | 0.04 | 0.15 | 0.07 | 0.3 | 0.03 | 1.5 | 10 | 0.35 | 0.8 | 20 | 0 | 0 | 0.2 |
| Sweet Lassi | Dairy-Based | 0.05 | 0.18 | 0.08 | 0.31 | 0.04 | 1.8 | 11 | 0.44 | 0.8 | 35 | 0.1 | 0.1 | 0.3 |
| Badam Milk (almond milk beverage) | Dairy-Based | 0.04 | 0.16 | 0.12 | 0.27 | 0.04 | 1.6 | 12 | 0.35 | 1 | 40 | 0 | 2 | 0.3 |
| Flavored Milk (chocolate) | Dairy-Based | 0.04 | 0.18 | 0.18 | 0.35 | 0.05 | 1.9 | 12 | 0.45 | 0.8 | 40 | 0.5 | 0.2 | 1 |
| Orange Juice (fresh squeezed) | Fruit Juices | 0.09 | 0.03 | 0.4 | 0.19 | 0.05 | 0.2 | 30 | 0 | 50 | 10 | 0 | 0.2 | 0.1 |
| Apple Juice (commercial, 100%) | Fruit Juices | 0.02 | 0.02 | 0.11 | 0.07 | 0.03 | 0.1 | 1 | 0 | 1 | 0.1 | 0 | 0 | 0.1 |
| Mango Juice/Nectar | Fruit Juices | 0.05 | 0.03 | 0.35 | 0.1 | 0.05 | 0.1 | 10 | 0 | 10 | 38 | 0 | 0.5 | 1.5 |
| Pomegranate Juice (100%) | Fruit Juices | 0.02 | 0.05 | 0.4 | 0.35 | 0.05 | 0.3 | 27 | 0 | 10 | 0 | 0 | 0.6 | 19 |
| Tomato Juice (unsalted) | Fruit Juices | 0.06 | 0.04 | 0.67 | 0.18 | 0.12 | 0.5 | 20 | 0 | 18 | 45 | 0 | 0.4 | 3.5 |
| Mixed Fruit Juice (commercial) | Fruit Juices | 0.04 | 0.03 | 0.25 | 0.1 | 0.04 | 0.1 | 8 | 0 | 20 | 20 | 0 | 0.2 | 1 |
| Sports Drink (Electrolyte) | Functional & Energy Drinks | 0.02 | 0.02 | 0.07 | 0 | 0 | 0 | 0 | 0 | 0 | 0 | 0 | 0 | 0 |
| Energy Drink (standard) | Functional & Energy Drinks | 0.3 | 0.35 | 8 | 2 | 0.4 | 10 | 40 | 0.4 | 0 | 0 | 0 | 0 | 0 |
| ORS Solution (WHO formula) | Functional & Energy Drinks | 0 | 0 | 0 | 0 | 0 | 0 | 0 | 0 | 0 | 0 | 0 | 0 | 0 |
| Black Tea (brewed, unsweetened) | Hot Beverages | 0.01 | 0.01 | 0.03 | 0.01 | 0 | 0 | 3 | 0 | 0 | 0 | 0 | 0 | 0 |
| Masala Chai (with milk & sugar) | Hot Beverages | 0.03 | 0.1 | 0.1 | 0.18 | 0.03 | 0.6 | 5 | 0.18 | 0.5 | 24 | 0 | 0.1 | 0.5 |
| Green Tea (brewed, unsweetened) | Hot Beverages | 0.01 | 0.02 | 0.03 | 0.01 | 0.01 | 0 | 5 | 0 | 0 | 0 | 0 | 0 | 0 |
| Instant Coffee (black, unsweetened) | Hot Beverages | 0.02 | 0.05 | 0.72 | 0.25 | 0.01 | 2 | 13 | 0 | 0 | 0 | 0 | 0 | 0 |
| Filter Coffee (with milk & sugar) | Hot Beverages | 0.03 | 0.09 | 0.6 | 0.2 | 0.02 | 1 | 8 | 0.15 | 0.5 | 20 | 0 | 0 | 0.5 |
| Espresso | Hot Beverages | 0.01 | 0.04 | 0.7 | 0.25 | 0.01 | 1 | 10 | 0 | 0 | 0 | 0 | 0 | 0 |
| Cappuccino (whole milk) | Hot Beverages | 0.04 | 0.15 | 0.4 | 0.22 | 0.04 | 0.9 | 10 | 0.3 | 0.6 | 42 | 0.5 | 0.1 | 0.3 |
| Hot Chocolate (whole milk) | Hot Beverages | 0.05 | 0.18 | 0.55 | 0.48 | 0.07 | 2 | 12 | 0.5 | 0.5 | 45 | 1 | 0.3 | 1 |
| Kahwa (Kashmiri Green Tea) | Hot Beverages | 0.01 | 0.01 | 0.05 | 0.01 | 0.01 | 0 | 3 | 0 | 0.5 | 0 | 0 | 0.1 | 0 |
| Soy Milk (unsweetened) | Plant-Based Beverages | 0.08 | 0.06 | 0.4 | 0.06 | 0.06 | 1.8 | 13 | 0 | 0 | 0 | 0.8 | 0.2 | 2.5 |
| Almond Milk (commercial, unsweet.) | Plant-Based Beverages | 0.01 | 0.03 | 0.04 | 0.03 | 0.01 | 0.3 | 2 | 0 | 0 | 0 | 1.2 | 6.5 | 0 |
| Oat Milk (commercial) | Plant-Based Beverages | 0.1 | 0.03 | 0.2 | 0.15 | 0.02 | 1.5 | 10 | 0 | 0 | 0 | 1.5 | 1.5 | 0.5 |
| Cola (regular) | Soft Drinks / Carbonated | 0 | 0 | 0 | 0 | 0 | 0 | 0 | 0 | 0 | 0 | 0 | 0 | 0 |
| Lemon-Lime Soda (regular) | Soft Drinks / Carbonated | 0 | 0 | 0 | 0 | 0 | 0 | 0 | 0 | 0 | 0 | 0 | 0 | 0 |
| Ginger Ale | Soft Drinks / Carbonated | 0 | 0 | 0 | 0 | 0 | 0 | 0 | 0 | 0 | 0 | 0 | 0 | 0 |
| Limca / Lemon Soda (Indian) | Soft Drinks / Carbonated | 0 | 0 | 0 | 0 | 0 | 0 | 0 | 0 | 0 | 0 | 0 | 0 | 0 |
| Nimbu Pani (Lemon Water, sweetened) | Traditional Indian | 0.02 | 0.01 | 0.06 | 0.08 | 0.04 | 0.1 | 5 | 0 | 18 | 0.5 | 0 | 0.1 | 0.5 |
| Aam Panna (Raw Mango Drink) | Traditional Indian | 0.04 | 0.03 | 0.3 | 0.1 | 0.05 | 0.2 | 12 | 0 | 15 | 45 | 0 | 0.6 | 2 |
| Kokum Sherbet | Traditional Indian | 0.02 | 0.02 | 0.1 | 0.05 | 0.03 | 0.1 | 4 | 0 | 3 | 2 | 0 | 0.2 | 0.5 |
| Thandai | Traditional Indian | 0.07 | 0.12 | 0.3 | 0.2 | 0.05 | 1.5 | 10 | 0.3 | 1 | 30 | 0 | 1.5 | 0.5 |
| Jal Jeera | Traditional Indian | 0.02 | 0.01 | 0.05 | 0.04 | 0.02 | 0.1 | 3 | 0 | 10 | 5 | 0 | 0.1 | 1 |
| Rose Sherbet (Rooh Afza style) | Traditional Indian | 0 | 0 | 0 | 0 | 0 | 0 | 0 | 0 | 0 | 0 | 0 | 0 | 0 |
| Sugarcane Juice (fresh) | Traditional Indian | 0.02 | 0.03 | 0.1 | 0.05 | 0.02 | 0 | 5 | 0 | 1.5 | 0 | 0 | 0.1 | 0 |
| Coconut Water (tender) | Traditional Indian | 0.07 | 0.06 | 0.08 | 0.04 | 0.03 | 0 | 16 | 0 | 2.4 | 0 | 0 | 0 | 0 |
Vitamin C (mg/100 ml)
- Orange Juice – 50 mg — dataset highest (133% ICMR adult RDA in 240 ml)
- Nimbu Pani & Tomato Juice 18 mg, Aam Panna 15 mg, Jal Jeera 10 mg
B12 — Dairy Only
- All dairy: 0.35–0.50 µg/100 ml
- All plant milks (unfortified), juices, teas, sodas: 0.00 µg
- Energy drink: 0.40 µg — entirely added
Vit E & D Leaders
- Almond Milk 6.5 mg Vit E — dataset highest (43× whole milk)
- Badam Milk 2.0 mg, Thandai 1.5 mg
- Vit D: Oat Milk 1.5 µg, Almond 1.2 µg, Soy 0.8 µg (all fortified)
Complete Mineral Profile per 100 ml — All 11 Minerals
Per 100 ml. Dairy beverages dominate on calcium (115–122 mg), selenium (2.5–3.8 µg), zinc, and phosphorus. Juices, coconut water, and traditional Indian drinks lead on potassium. Tea carries the highest fluoride (215–373 µg/100 ml) and manganese. Soft drinks are mineral-free — trace fluoride from production water is their only mineral entry. Jal Jeera’s sodium of 250 mg/100 ml is the dataset maximum, from kala namak.
Table 4: Minerals per 100 ml
| Beverage | Category | Region | Calcium (mg) | Phosphorus (mg) | Potassium (mg) | Sodium (mg) | Magnesium (mg) | Iron (mg) | Zinc (mg) | Copper (mg) | Manganese (mg) | Selenium (µg) | Fluoride (µg) |
|---|---|---|---|---|---|---|---|---|---|---|---|---|---|
| Black Tea (brewed, unsweetened) | Hot Beverages | Indian/International | 0 | 1 | 37 | 1 | 3 | 0.02 | 0.02 | 0.01 | 0.22 | 0.1 | 373 |
| ORS Solution (WHO formula) | Functional & Energy Drinks | International | 0 | 0 | 78.5 | 90 | 0 | 0 | 0 | 0 | 0 | 0 | 0 |
| Green Tea (brewed, unsweetened) | Hot Beverages | Indian/International | 1 | 1 | 20 | 1 | 1 | 0.05 | 0.01 | 0.01 | 0.45 | 0.1 | 215 |
| Espresso | Hot Beverages | International | 2 | 12 | 116 | 4 | 6 | 0.06 | 0.05 | 0.08 | 0.07 | 0.1 | 200 |
| Rose Sherbet (Rooh Afza style) | Traditional Indian | Indian | 2 | 1 | 15 | 10 | 1 | 0.02 | 0.01 | 0.01 | 0.01 | 0 | 40 |
| Cola (regular) | Soft Drinks / Carbonated | International | 2 | 9 | 2 | 4 | 0 | 0.02 | 0 | 0 | 0 | 0.1 | 85 |
| Limca / Lemon Soda (Indian) | Soft Drinks / Carbonated | Indian | 2 | 2 | 5 | 18 | 1 | 0 | 0 | 0 | 0 | 0.1 | 80 |
| Energy Drink (standard) | Functional & Energy Drinks | International | 2 | 8 | 45 | 50 | 3 | 0 | 0.02 | 0.02 | 0 | 0 | 80 |
| Kahwa (Kashmiri Green Tea) | Hot Beverages | Indian | 3 | 2 | 22 | 2 | 2 | 0.04 | 0.01 | 0.02 | 0.2 | 0.1 | 200 |
| Nimbu Pani (Lemon Water, sweetened) | Traditional Indian | Indian | 3 | 5 | 38 | 5 | 3 | 0.05 | 0.03 | 0.02 | 0.01 | 0.1 | 55 |
| Ginger Ale | Soft Drinks / Carbonated | International | 3 | 1 | 2 | 13 | 1 | 0.02 | 0.01 | 0 | 0 | 0.1 | 90 |
| Sports Drink (Electrolyte) | Functional & Energy Drinks | International | 3 | 0 | 38 | 50 | 1 | 0 | 0 | 0 | 0 | 0 | 80 |
| Jal Jeera | Traditional Indian | Indian | 4 | 5 | 45 | 250 | 4 | 0.08 | 0.04 | 0.04 | 0.05 | 0.1 | 100 |
| Instant Coffee (black, unsweetened) | Hot Beverages | International | 5 | 7 | 66 | 2 | 6 | 0.01 | 0.05 | 0.04 | 0.07 | 0.1 | 230 |
| Lemon-Lime Soda (regular) | Soft Drinks / Carbonated | International | 5 | 3 | 3 | 10 | 1 | 0 | 0 | 0 | 0 | 0.1 | 90 |
| Aam Panna (Raw Mango Drink) | Traditional Indian | Indian | 6 | 8 | 72 | 10 | 6 | 0.1 | 0.05 | 0.05 | 0.04 | 0.2 | 50 |
| Apple Juice (commercial, 100%) | Fruit Juices | International | 8 | 10 | 101 | 3 | 5 | 0.1 | 0.02 | 0.02 | 0.09 | 0.1 | 55 |
| Kokum Sherbet | Traditional Indian | Indian (Western) | 10 | 5 | 55 | 15 | 5 | 0.08 | 0.04 | 0.06 | 0.02 | 0.1 | 50 |
| Sugarcane Juice (fresh) | Traditional Indian | Indian | 10 | 10 | 162 | 5 | 9 | 0.18 | 0.04 | 0.1 | 0.12 | 0.1 | 35 |
| Tomato Juice (unsalted) | Fruit Juices | International | 10 | 19 | 218 | 10 | 11 | 0.4 | 0.16 | 0.07 | 0.07 | 0.5 | 50 |
| Mixed Fruit Juice (commercial) | Fruit Juices | Indian | 10 | 12 | 120 | 15 | 8 | 0.15 | 0.05 | 0.04 | 0.05 | 0.2 | 50 |
| Orange Juice (fresh squeezed) | Fruit Juices | International | 11 | 17 | 200 | 1 | 11 | 0.2 | 0.05 | 0.04 | 0.02 | 0.1 | 50 |
| Pomegranate Juice (100%) | Fruit Juices | International | 11 | 16 | 214 | 9 | 12 | 0.17 | 0.09 | 0.05 | 0.13 | 0.1 | 50 |
| Mango Juice/Nectar | Fruit Juices | Indian/International | 12 | 12 | 115 | 10 | 9 | 0.15 | 0.04 | 0.06 | 0.04 | 0.2 | 50 |
| Coconut Water (tender) | Traditional Indian | Indian/International | 24 | 20 | 250 | 105 | 25 | 0.29 | 0.1 | 0.04 | 0.14 | 1 | 165 |
| Soy Milk (unsweetened) | Plant-Based Beverages | International | 25 | 55 | 118 | 51 | 25 | 0.5 | 0.28 | 0.15 | 0.22 | 3.4 | 0 |
| Filter Coffee (with milk & sugar) | Hot Beverages | Indian (South) | 72 | 60 | 155 | 32 | 10 | 0.08 | 0.32 | 0.02 | 0.08 | 1.2 | 200 |
| Thandai | Traditional Indian | Indian | 80 | 75 | 140 | 40 | 25 | 0.2 | 0.45 | 0.1 | 0.25 | 2 | 40 |
| Masala Chai (with milk & sugar) | Hot Beverages | Indian | 85 | 72 | 180 | 40 | 12 | 0.1 | 0.38 | 0.02 | 0.15 | 1.5 | 220 |
| Cappuccino (whole milk) | Hot Beverages | International | 105 | 90 | 160 | 55 | 13 | 0.05 | 0.43 | 0.03 | 0.05 | 2.5 | 130 |
| Hot Chocolate (whole milk) | Hot Beverages | International | 110 | 95 | 185 | 65 | 22 | 0.55 | 0.55 | 0.18 | 0.15 | 2.3 | 100 |
| Toned Milk (2.5% fat) | Dairy-Based | Indian | 115 | 90 | 130 | 48 | 12 | 0.05 | 0.38 | 0.02 | 0.01 | 3.5 | 35 |
| Buttermilk (Chaas, salted) | Dairy-Based | Indian | 115 | 85 | 135 | 180 | 11 | 0.04 | 0.35 | 0.01 | 0.01 | 3.2 | 40 |
| Badam Milk (almond milk beverage) | Dairy-Based | Indian | 115 | 88 | 150 | 48 | 18 | 0.1 | 0.38 | 0.04 | 0.05 | 2.5 | 35 |
| Flavored Milk (chocolate) | Dairy-Based | International | 115 | 92 | 160 | 72 | 18 | 0.35 | 0.42 | 0.05 | 0.08 | 3.5 | 40 |
| Whole Cow's Milk | Dairy-Based | Indian/International | 120 | 93 | 132 | 49 | 13 | 0.05 | 0.38 | 0.02 | 0.01 | 3.7 | 35 |
| Sweet Lassi | Dairy-Based | Indian | 120 | 90 | 145 | 50 | 12 | 0.04 | 0.38 | 0.01 | 0.01 | 3.5 | 38 |
| Oat Milk (commercial) | Plant-Based Beverages | International | 120 | 55 | 80 | 67 | 16 | 0.18 | 0.12 | 0.04 | 0.23 | 1 | 0 |
| Skim Milk (0.1% fat) | Dairy-Based | International | 122 | 96 | 150 | 51 | 11 | 0.03 | 0.4 | 0.01 | 0.01 | 3.8 | 35 |
| Almond Milk (commercial, unsweet.) | Plant-Based Beverages | International | 188 | 15 | 67 | 72 | 17 | 0.42 | 0.06 | 0.07 | 0.26 | 0.3 | 0 |
Potassium Leaders (mg/100 ml)
- Coconut Water 250 mg — dataset highest
- Tomato Juice 218, Pomegranate 214, OJ 200 mg
- Cola: 2 mg (125× lower than coconut water)
Calcium (mg/100 ml)
- Natural: Skim Milk 122, Whole Milk 120, Cappuccino 105
- Fortified: Almond Milk 188 mg (highest in dataset)
- 250 ml glass whole milk = ~300 mg Ca (30% ICMR adult RDA)
Fluoride & Iron
- Black Tea 373 µg fluoride — dataset highest
- Two 240-ml cups = ~897 µg/day toward dental health
- Iron: Hot Chocolate 0.55 mg, Soy Milk 0.50 mg, Tomato Juice 0.40 mg
Bioactive Compounds per 100 ml — What Standard Labels Never Show
Per 100 ml. Bioactives are food-derived compounds that influence biological processes beyond basic nutrition — standard nutrition labels never display them. The standout findings: espresso ORAC 7,860 µmol TE leads all 40 beverages; pomegranate juice polyphenols 450 mg leads all beverages; green tea EGCG 30 mg is present in no other drink; tomato juice lycopene 9,000 µg appears in no other beverage. All four soft drinks record ORAC values of 5–10 — 800–1,500× lower than espresso. Source: Phenol-Explorer v3.6, USDA FoodData Central, peer-reviewed literature.
Table 5: Bioactive Compounds per 100 ml
| Beverage | Category | Caffeine (mg) | Polyphenols (mg) | Catechins (mg) | EGCG (mg) | Chlorogenic Acid (mg) | Lycopene (µg) | β-Carotene (µg) | ORAC (µmol TE) | Key Bioactive Notes |
|---|---|---|---|---|---|---|---|---|---|---|
| Aam Panna (Raw Mango Drink) | Traditional Indian | 0 | 25 | 0 | 0 | 0 | 0 | 185 | 850 | Beta-carotene 185 µg/100ml; pectin from raw mango; cumin adds iron |
| Almond Milk (commercial, unsweet.) | Plant-Based Beverages | 0 | 5 | 0 | 0 | 0 | 0 | 0 | 50 | Amygdalin trace; high Vit E from almonds; very low protein vs whole almonds; fortified |
| Apple Juice (commercial, 100%) | Fruit Juices | 0 | 15 | 0 | 0 | 10 | 0 | 2 | 220 | Quercetin trace; chlorogenic acid 10 mg; malic acid (2 g/100ml) |
| Badam Milk (almond milk beverage) | Dairy-Based | 0 | 5 | 0 | 0 | 0 | 0 | 10 | 120 | Amygdalin trace (from almonds); high Vit E from almonds; saffron added |
| Black Tea (brewed, unsweetened) | Hot Beverages | 29 | 170 | 25 | 0 | 0 | 0 | 0 | 1128 | Theaflavins 35 mg, Thearubigins 120 mg, L-Theanine 6 mg/100ml |
| Buttermilk (Chaas, salted) | Dairy-Based | 0 | 0 | 0 | 0 | 0 | 0 | 8 | 30 | Probiotics (Lactobacillus spp.) if cultured; cooling in nature (Ayurveda) |
| Cappuccino (whole milk) | Hot Beverages | 85 | 95 | 0 | 0 | 55 | 0 | 0 | 1900 | Milk proteins bind polyphenols reducing bioavailability |
| Coconut Water (tender) | Traditional Indian | 0 | 0 | 0 | 0 | 0 | 0 | 0 | 90 | Cytokinins (anti-aging); L-arginine 75 mg; natural electrolyte rehydration |
| Cola (regular) | Soft Drinks / Carbonated | 9.5 | 0 | 0 | 0 | 0 | 0 | 0 | 10 | Phosphoric acid (acidulant, pH 2.5); caramel color (class IV); CO2 carbonation; high HFCS |
| Energy Drink (standard) | Functional & Energy Drinks | 80 | 0 | 0 | 0 | 0 | 0 | 0 | 0 | Taurine 400 mg/100ml; Glucuronolactone 120 mg; added B-vitamins; high sugar + caffeine |
| Espresso | Hot Beverages | 212 | 280 | 0 | 0 | 150 | 0 | 0 | 7860 | Highest caffeine concentration; cafestol & kahweol 2 mg/shot (unfiltered) |
| Filter Coffee (with milk & sugar) | Hot Beverages | 45 | 60 | 0 | 0 | 38 | 0 | 0 | 1800 | South Indian style decoction; chlorogenic acids partially reduced |
| Flavored Milk (chocolate) | Dairy-Based | 2 | 30 | 0 | 0 | 0 | 0 | 12 | 250 | Cocoa flavonoids moderate; added sugars high; fortified with vitamins in brands |
| Ginger Ale | Soft Drinks / Carbonated | 0 | 5 | 0 | 0 | 0 | 0 | 0 | 50 | Gingerol trace if natural; mostly artificial ginger flavor in commercial brands |
| Green Tea (brewed, unsweetened) | Hot Beverages | 12 | 130 | 60 | 30 | 0 | 0 | 0 | 1253 | EGCG 30 mg (major catechin); L-Theanine 8 mg; EGC 12 mg |
| Hot Chocolate (whole milk) | Hot Beverages | 3.5 | 150 | 0 | 0 | 0 | 0 | 0 | 3430 | Cocoa flavanols (flavan-3-ols) 50 mg; theobromine 25 mg |
| Instant Coffee (black, unsweetened) | Hot Beverages | 57 | 80 | 0 | 0 | 45 | 0 | 0 | 2780 | Chlorogenic acids 45 mg; Trigonelline 25 mg; diterpenes cafestol/kahweol trace |
| Jal Jeera | Traditional Indian | 0 | 15 | 0 | 0 | 0 | 0 | 0 | 300 | Cuminaldehyde from jeera; piperine trace; tamarind tartaric acid; digestive stimulant |
| Kahwa (Kashmiri Green Tea) | Hot Beverages | 8 | 90 | 40 | 20 | 0 | 0 | 0 | 950 | Saffron adds safranal (aroma); cardamom adds cineole; cinnamon polyphenols |
| Kokum Sherbet | Traditional Indian | 0 | 40 | 0 | 0 | 0 | 0 | 0 | 950 | Hydroxycitric acid (HCA) 1.5 mg; anthocyanins (cyanidin-3-glucoside) 18 mg |
| Lemon-Lime Soda (regular) | Soft Drinks / Carbonated | 0 | 0 | 0 | 0 | 0 | 0 | 0 | 5 | Citric acid; CO2; no nutritional value; artificial lemon flavor |
| Limca / Lemon Soda (Indian) | Soft Drinks / Carbonated | 0 | 0 | 0 | 0 | 0 | 0 | 0 | 5 | Citric acid; HFCS; artificial lime flavor; CO2 carbonation; no nutrients |
| Mango Juice/Nectar | Fruit Juices | 0 | 25 | 0 | 0 | 0 | 0 | 155 | 560 | Mangiferin 5 mg; zeaxanthin 15 µg; gallic acid from peel (commercial lower) |
| Masala Chai (with milk & sugar) | Hot Beverages | 22 | 120 | 18 | 0 | 0 | 0 | 12 | 820 | L-Theanine 4 mg; spices add cinnamon phenols; milk reduces ORAC |
| Mixed Fruit Juice (commercial) | Fruit Juices | 0 | 20 | 0 | 0 | 0 | 0 | 30 | 350 | Variable polyphenols; added Vitamin C common in Indian brands; check labels |
| Nimbu Pani (Lemon Water, sweetened) | Traditional Indian | 0 | 20 | 0 | 0 | 0 | 0 | 5 | 330 | Limonene (lemon essential oil trace); hesperidin ~5 mg; alkalizing effect |
| Oat Milk (commercial) | Plant-Based Beverages | 0 | 0 | 0 | 0 | 0 | 0 | 0 | 40 | Beta-glucan 0.3 g/100ml (soluble fiber); avenanthramides (anti-inflammatory); fortified |
| Orange Juice (fresh squeezed) | Fruit Juices | 0 | 30 | 0 | 0 | 0 | 0 | 30 | 750 | Hesperidin 25 mg; narirutin 15 mg; d-limonene trace; flavanones high |
| ORS Solution (WHO formula) | Functional & Energy Drinks | 0 | 0 | 0 | 0 | 0 | 0 | 0 | 0 | NaCl 2.6 g/L, KCl 1.5 g/L, Glucose 13.5 g/L, Na citrate 2.9 g/L per WHO 2006 formula |
| Pomegranate Juice (100%) | Fruit Juices | 0 | 450 | 0 | 0 | 0 | 0 | 0 | 2341 | Punicalagins 50 mg; ellagic acid 18 mg; anthocyanins 15 mg; highest ORAC of juices |
| Rose Sherbet (Rooh Afza style) | Traditional Indian | 0 | 5 | 0 | 0 | 0 | 0 | 0 | 80 | Artificial colors in commercial brands; rosewater may contain geraniol; high sugar |
| Skim Milk (0.1% fat) | Dairy-Based | 0 | 0 | 0 | 0 | 0 | 0 | 2 | 25 | Minimal CLA; nearly fat-free; vitamin A must be added if fortified |
| Soy Milk (unsweetened) | Plant-Based Beverages | 0 | 30 | 0 | 0 | 0 | 0 | 0 | 180 | Isoflavones: genistein 12 mg, daidzein 8 mg/100ml; phytoestrogen activity; phytic acid |
| Sports Drink (Electrolyte) | Functional & Energy Drinks | 0 | 0 | 0 | 0 | 0 | 0 | 0 | 0 | Chloride, citrate as electrolytes; dextrose as carbohydrate source; artificial color |
| Sugarcane Juice (fresh) | Traditional Indian | 0 | 50 | 0 | 0 | 0 | 0 | 0 | 500 | Chlorogenic acid, caffeic acid; policosanol 0.05 mg; high glycemic index ~65 |
| Sweet Lassi | Dairy-Based | 0 | 0 | 0 | 0 | 0 | 0 | 12 | 30 | Probiotic (Lactobacillus spp.); rosewater may be added; high sugar variant |
| Thandai | Traditional Indian | 0 | 30 | 0 | 0 | 0 | 0 | 12 | 400 | Alkaloids from pepper; eugenol from tulsi/basil; rose flavonoids; melatonin precursors from poppy seeds |
| Tomato Juice (unsalted) | Fruit Juices | 0 | 40 | 0 | 0 | 0 | 9000 | 40 | 486 | Lycopene 9 mg/100ml (primary carotenoid); rutin 5 mg; GABA 40 mg |
| Toned Milk (2.5% fat) | Dairy-Based | 0 | 0 | 0 | 0 | 0 | 0 | 10 | 35 | Lower CLA than whole milk; casein & whey proteins intact |
| Whole Cow's Milk | Dairy-Based | 0 | 0 | 0 | 0 | 0 | 0 | 15 | 40 | Conjugated Linoleic Acid (CLA) ~0.05 g/100ml; bioactive peptides on digestion |
ORAC Top 5 (all 40 beverages)
- Espresso 7,860 — dataset leader
- Hot Chocolate 3,430; Instant Coffee 2,780
- Pomegranate Juice 2,341; Cappuccino 1,900
Unique Bioactives
- EGCG: Green Tea 30 mg — no other beverage has any
- Lycopene: Tomato Juice 9,000 µg — no other has any
- Isoflavones: Soy Milk genistein 12 + daidzein 8 mg
- HCA: Kokum Sherbet 1.5 mg; Anthocyanins: Kokum 18 mg
Caffeine (mg/100 ml)
- Espresso 212 → Energy Drink 80 → Cappuccino 85
- Instant Coffee 57 → Filter Coffee 45 → Black Tea 29
- Green Tea 12 → Kahwa 8 → Cola 9.5
- All dairy, juices, traditional drinks: 0 mg
Category 1
Hot Beverages
Hot beverages divide into two nutritional identities. Plain brews — black tea, green tea, instant coffee, kahwa — contribute essentially zero macronutrients but are among the most bioactive-rich drinks in the dataset. Milk-added preparations — masala chai, filter coffee, cappuccino, hot chocolate — acquire full nutritional significance from their dairy component, adding protein (2.2–4.2 g/100 ml), calcium (72–110 mg), and B12 (0.15–0.50 µg).
Black Tea
Nutritionally transparent in Tables 1–4 but vital in Table 5. Theaflavins (35 mg) and thearubigins (120 mg) are oxidised catechin products unique to fermented black tea. L-Theanine at 6 mg/100 ml modulates caffeine’s effects, producing calmer alertness than equivalent coffee doses. The 373 µg fluoride/100 ml contributes meaningfully to dental and bone mineralisation at habitual intake — two 240-ml cups deliver ~897 µg fluoride daily.
Masala Chai
India’s most-consumed beverage is genuinely multi-nutritional. A 200 ml cup delivers 4.8 g protein, 170 mg calcium (~17% ICMR adult RDA), and 0.36 µg B12. The milk casein binding to tea polyphenols explains why ORAC (820) is 27% lower than plain black tea (1,128). Spice compounds — ginger gingerols, cinnamon proanthocyanidins, cardamom cineole — add bioactive complexity not fully captured in the aggregate polyphenol figure.
Green Tea
Tables 1–4 show near-zero nutritional value except fluoride (215 µg/100 ml). Green tea’s entire functional value resides in Table 5: EGCG at 30 mg/100 ml is the highest in the dataset, present in no other beverage type. EGCG is the most studied dietary catechin for cardiovascular protection and LDL oxidation reduction. L-Theanine at 8 mg/100 ml is the highest tea value — producing calmer alertness than equivalent-caffeine coffee.
Instant Coffee · Filter Coffee · Espresso
Coffee is the most antioxidant-dense beverage in this dataset — a fact widely misattributed to green tea. Espresso leads all 40 beverages on ORAC (7,860 µmol TE/100 ml) and polyphenols (280 mg/100 ml). Niacin in instant coffee (0.72 mg/100 ml) is a roasting artefact — the highest naturally occurring B3 of any hot beverage, contributing meaningfully at habitual 2-cup consumption. Filter coffee at 150 ml serving delivers 112.5 kcal, 3.3 g protein, 72 mg calcium from its high milk ratio.
Hot Chocolate (whole milk)
Hot chocolate tops the category on vitamin D (1.0 µg), B12 (0.50 µg), iron (0.55 mg), and zinc (0.55 mg) — the iron and zinc coming from the cocoa fraction. ORAC of 3,430 ranks 2nd in the hot beverage group. A 240 ml serving delivers 27.6 g sugar — highest of any hot drink — contextualising this nutritional richness against its glycaemic load.
Kahwa (Kashmiri Green Tea)
Kahwa retains 20 mg EGCG despite spice dilution from the green tea base. Saffron’s safranal and crocin have clinical-trial evidence for mood modulation. At only 8 mg caffeine/100 ml — the lowest-caffeine hot drink in the dataset — it suits caffeine-sensitive individuals seeking catechin benefits without stimulant load.
Category 2
Dairy-Based Beverages
Dairy beverages are the most nutritionally consistent category. Protein (3.2–3.5 g/100 ml), calcium (115–122 mg), selenium (2.5–3.8 µg), and B12 (0.35–0.50 µg) hold steady across all seven drinks regardless of fat level. For India’s ~38% vegetarian population, dairy beverages are the primary dietary source of B12 — no other beverage category in this dataset provides it naturally.
Whole Milk · Toned Milk · Skim Milk
The three milk types are nutritionally equivalent on protein, calcium, selenium, and B12. Fat reduction matters primarily for fat-soluble vitamins (Table 3): vitamin A collapses from 46 µg (whole) to 7 µg (skim); vitamin D disappears in skim. Per 250 ml glass: ~300 mg calcium (30% ICMR adult RDA), 8.0–8.5 g protein, ~1.1 µg B12 (~50% of ICMR 2.2 µg/day RDA). Toned milk (Indian standard) delivers nearly identical macro-mineral-vitamin quality to whole milk at 50 vs 61 kcal/100 ml.
Buttermilk / Chaas
Best protein-per-calorie ratio of any dairy drink: 7.0 g protein at 80 kcal per 200 ml serving. Its sodium of 180 mg/100 ml from added black salt makes it functionally appropriate for summer electrolyte replacement. Traditionally cultured chaas carries viable Lactobacillus spp. — the primary probiotic beverage in this dataset among non-fortified options.
Sweet Lassi
Nutritional protein-calcium profile matches whole milk, but Table 2 sugar at a 250 ml serving reaches 28.8 g — exceeding WHO free-sugar daily guidance in one drink. Homemade lassi from fresh dahi retains viable Lactobacillus; commercial pasteurised lassi does not.
Badam Milk
Vitamin E of 2.0 mg/100 ml (Table 3) — highest of any dairy-based drink — from the almond fraction. A 200 ml serving provides 4.0 mg Vit E (~27% adult RDA). Magnesium at 18 mg/100 ml is elevated above plain milk. At 22 g sugar per 200 ml serving (Table 2), it is calorically dense but uniquely nutritious among Indian hot dairy preparations.
Category 3
Traditional Indian Beverages
India’s traditional beverage portfolio is the most bioactively diverse category in the dataset. Eight drinks span 19–110 kcal/100 ml with entirely different vitamin and mineral signatures. Coconut water leads the entire dataset on potassium; aam panna leads on beta-carotene among traditional drinks; kokum sherbet carries anthocyanins found in no other beverage; jal jeera has the dataset’s highest sodium. These are function-specific drinks whose traditional seasonal roles align precisely with their nutritional profiles.
Coconut Water
Leads all 40 beverages on potassium at 250 mg/100 ml (Table 4) — 125× higher than cola. Its K+Na+Mg electrolyte balance approximates the WHO ORS formula ratios while providing 19 kcal and 1.1 g fiber (Table 1). The cytokinins (trans-zeatin, kinetin) noted in Table 5 are phytohormone-class compounds under research for anti-ageing properties. At 6.2 g sugar per 240 ml serving (Table 2), it is the lowest-calorie beverage with genuine electrolyte significance in the dataset.
Aam Panna
Vitamin A 45 µg RAE (Table 3) matches whole cow’s milk — delivered through beta-carotene 185 µg (Table 5), the second-highest of any beverage. Raw pre-ripe mango retains higher carotenoid density than ripe mango, making this drink optimally nutritious when made from unripe fruit. Vitamin C at 15 mg directly addresses heat-driven depletion. Pectin from raw mango supports gut water retention during heat stress.
Kokum Sherbet
Unique to India’s western coastal cuisine. Anthocyanins (cyanidin-3-glucoside) at 18 mg/100 ml (Table 5) give it ORAC of 950 — the highest of any Indian traditional beverage. Hydroxycitric acid (HCA) at 1.5 mg/100 ml is the compound studied for fat oxidation inhibition. Dietary fiber at 0.5 g/100 ml (Table 1) is the highest of any Indian traditional drink.
Nimbu Pani | Jal Jeera
Nimbu pani’s 18 mg vitamin C (Table 3) is the highest vitamin C of any Indian traditional drink. A 250 ml glass provides 45 mg — 50% of ICMR adult RDA. Lemon citrate metabolises to bicarbonate, raising urinary pH — relevant for kidney stone prevention. Jal jeera’s sodium of 250 mg/100 ml (Table 4, from kala namak) is the highest in the entire dataset — making it the most sodium-effective summer electrolyte drink, alongside cuminaldehyde’s documented digestive-stimulant action.
Thandai | Rose Sherbet
Thandai combines milk’s B12-calcium matrix with almond vitamin E, melon-poppy seed magnesium (25 mg matching coconut water), and black pepper piperine — the most nutritionally complex traditional Indian drink. At 220 kcal/serving (Table 2), it is the highest-calorie beverage in the dataset. Rose sherbet is the nutritional outlier: Table 3 vitamins are all zero, Table 4 minerals negligible, Table 5 ORAC is just 80 — commercially it is a sugar solution with artificial colour.
Category 4
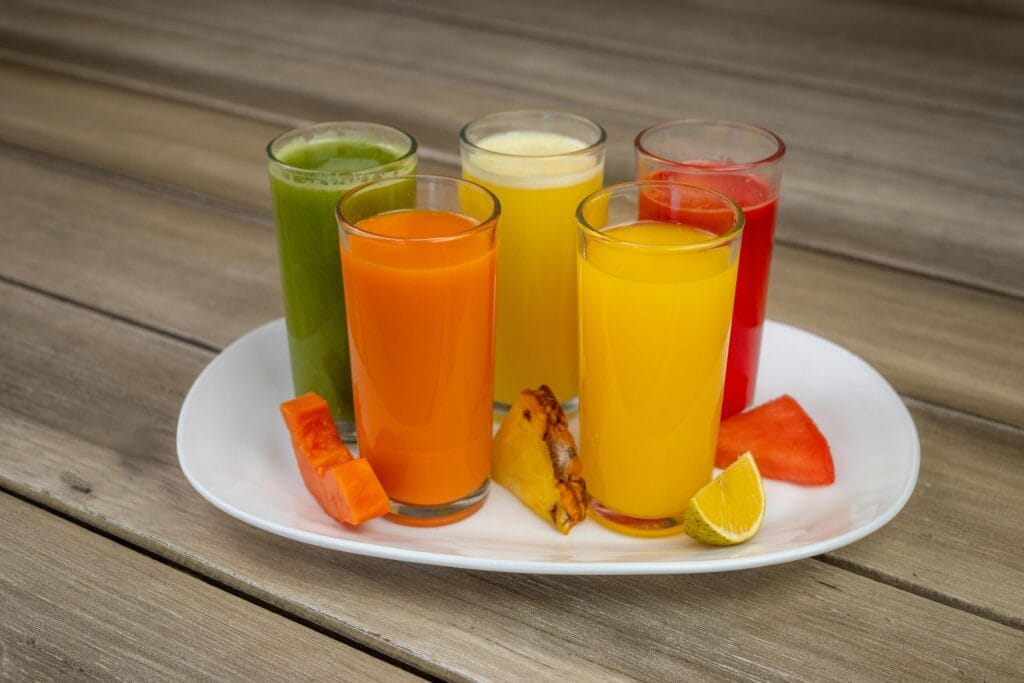
Fruit Juices
Fruit juices deliver genuine vitamins and bioactives absent from soft drinks — but concentrated sugars and near-zero fiber (Table 1: 0.1–0.5 g/100 ml) create metabolic responses closer to sugar-sweetened beverages than whole fruit. WHO classifies all juice sugar as free sugar. The nutritional case for juice depends on which specific nutrients are needed — and at what sugar cost. Each juice has a different answer.
Orange Juice (fresh squeezed)
Leads all 40 beverages on vitamin C at 50 mg/100 ml (Table 3) and ties for highest natural folate at 30 µg/100 ml. A 240 ml glass: 120 mg vitamin C (133% ICMR adult RDA) and 72 µg folate (18% RDA). Sodium of just 1 mg/100 ml (Table 4) is the lowest of any juice — useful for hypertension management. Hesperidin and narirutin flavanones (Table 5) have independent evidence for endothelial protection.
Pomegranate Juice (100%)
Leads all 40 beverages on polyphenols (450 mg/100 ml, Table 5) and ORAC (2,341). Punicalagins at 50 mg/100 ml are gut-metabolised to urolithins — one of few dietary polyphenol metabolites with RCT-validated anti-inflammatory effects. Vitamin K at 19 µg/100 ml (Table 3) is the dataset’s highest naturally occurring Vit K value. Sugar at 9.8 g/100 ml (Table 1) is lower than most other juices — best nutrient-to-sugar ratio of any juice.
Tomato Juice (unsalted)
The most exceptional juice in the dataset. At 17 kcal/100 ml and 2.6 g sugar (Table 1) — lowest of any juice — it provides lycopene 9,000 µg (Table 5), potassium 218 mg (Table 4, highest of any juice), vitamin C 18 mg, vitamin A 45 µg RAE, and folate 20 µg (Table 3). Lycopene bioavailability from processed tomato exceeds raw tomatoes. GABA at 40 mg/100 ml (Table 5 notes) is the only GABA-significant entry in this dataset, with antihypertensive associations in clinical trials.
Apple Juice — The Weakest Juice
Commercial processing eliminates most of whole apple’s polyphenol content. Folate at 1 µg/100 ml (Table 3) is the lowest of any juice — compare orange juice’s 30 µg. Vitamin C at 1.0 mg. ORAC 220 is the lowest of any juice (pomegranate: 2,341). Its sugar of 10.9 g/100 ml with minimal nutritional return makes it the least-justified juice on nutrient-to-sugar basis.
Category 5
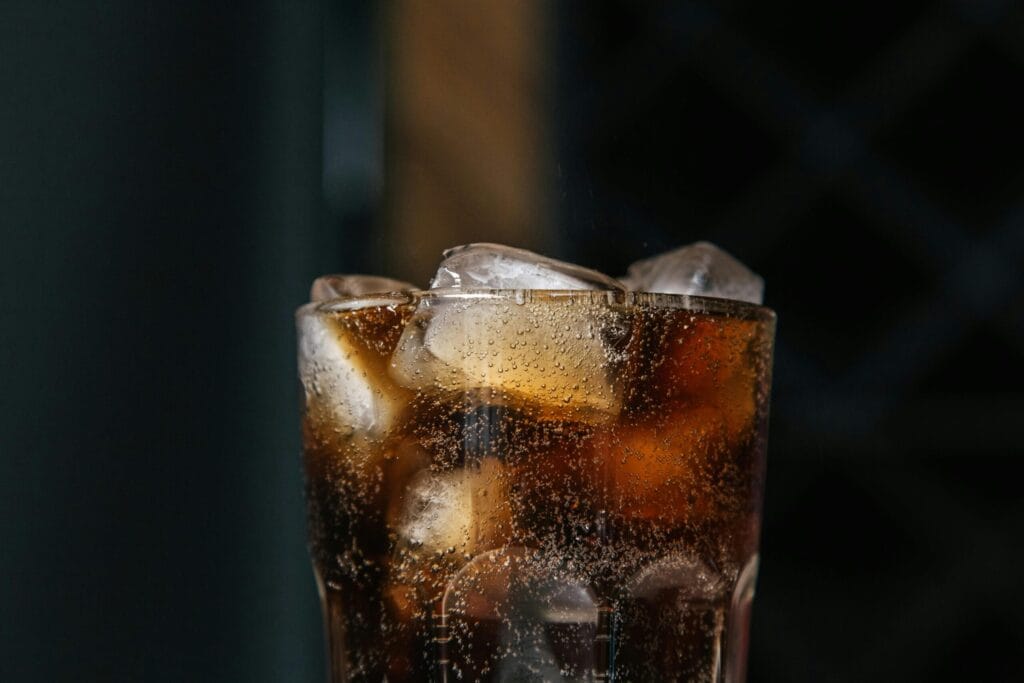
Soft Drinks & Carbonated Beverages
The defining nutritional fact about soft drinks is the Tables 3 and 4 data — specifically what is absent. All four carbonated beverages register zero across every one of the 13 vitamin columns in Table 3 and near-zero across all 11 mineral columns in Table 4. No exceptions. This reflects the genuine composition of beverages made from filtered water, sweeteners, acidulants, flavourings, and CO₂.
Cola (regular)
A 355 ml can delivers 149 kcal and 37.6 g free sugar — exceeding WHO 25 g/day free-sugar limit in one drink. Phosphoric acid (Table 5 notes, pH 2.5) chelates calcium in the digestive tract — concerning for India’s population where calcium inadequacy is already widespread. Caramel color Class IV generates 4-methylimidazole under regulatory scrutiny. Caffeine at 9.5 mg/100 ml is often overlooked in children’s consumption discussions.
Lemon-Lime Soda · Ginger Ale · Limca
Lemon-lime soda at 355 ml delivers 38.7 g sugar — the highest per-serving sugar of any beverage in this dataset. Ginger ale ORAC of 50 is marginally higher than cola (10) if natural ginger extract is used, but commercial versions use artificial flavour, making it functionally equivalent. Limca (300 ml, 28.5 g sugar/serving) is the Indian counterpart — identical nutritional absence. All four soft drinks are interchangeable in their nutritional profile: zero vitamins, zero minerals, calories from pure free sugar.
Category 6
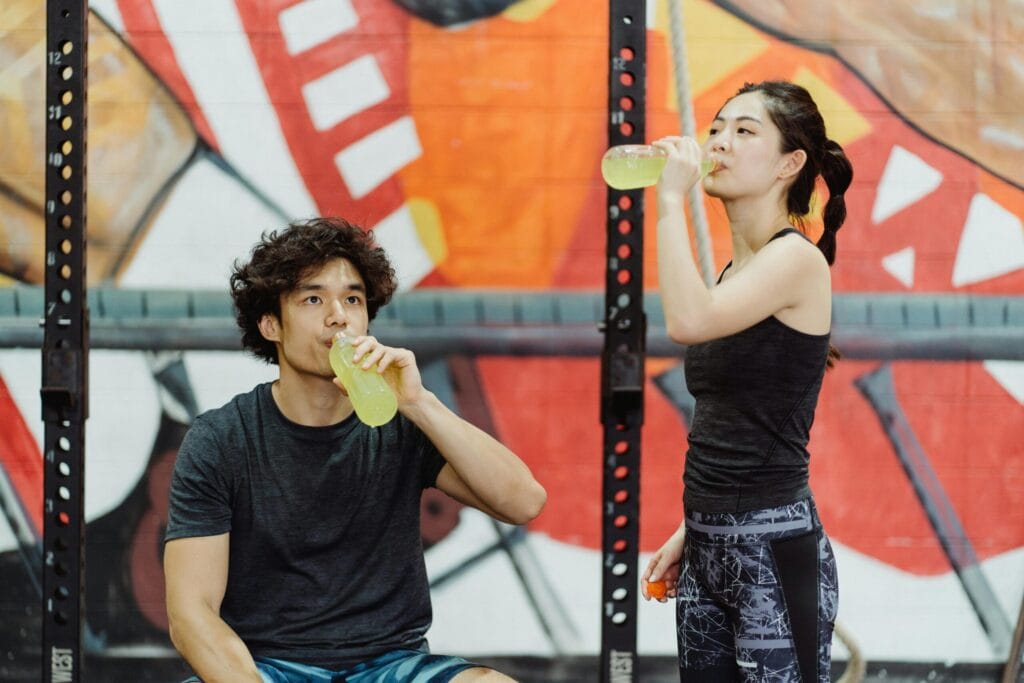
Functional & Energy Drinks
Three beverages with entirely different design philosophies. ORS is engineered for one physiological function with no nutritional extras. Energy drink is fortified to appear nutritionally comprehensive while delivering pharmacological caffeine stimulation. Sports drink is a moderate electrolyte-carbohydrate formulation appropriate only during sustained physical activity.
Energy Drink (standard)
Table 3 vitamins look impressive: B3 8.0 mg/100 ml (dataset highest), folate 40 µg, biotin 10 µg, B12 0.40 µg — all from fortification. B-vitamins are cofactors, not energy sources; they cannot create energy without substrate. The actual stimulant source is Table 5: 80 mg caffeine/100 ml = 200 mg per 250 ml can — equivalent to 3.5 cups of black tea. Taurine (400 mg/100 ml) and glucuronolactone (120 mg/100 ml) are at concentrations far above normal dietary intake; evidence for acute ergogenic benefit is mixed. FSSAI guidelines limit caffeine in food products to 145 mg per serving.
ORS Solution (WHO 2006 formula)
The most precisely engineered beverage in this dataset. Tables 3 and 5 are uniformly zero — by design. Its Table 4 Na+K ratio is calculated for SGLT1 cotransporter optimisation. The 3.2 g glucose (Table 1) functions as cotransporter substrate, not calorie. This is the only beverage in the dataset whose value is entirely invisible in a standard nutrient label — its clinical significance lies in the ionic ratio, not in vitamins, minerals, or bioactives.
Sports Drink (Electrolyte)
Appropriate for sustained activity of 60+ minutes at moderate-to-high intensity. For sedentary and lightly active individuals, 500 ml = 26.5 g sugar (Table 2) without justifying electrolyte need. Chaas (Na 180 mg, K 135 mg, protein 3.5 g, Ca 115 mg, Table 4) outperforms commercial sports drinks for the vast majority of everyday hydration contexts while providing superior mineral complexity at lower cost.
Category 7
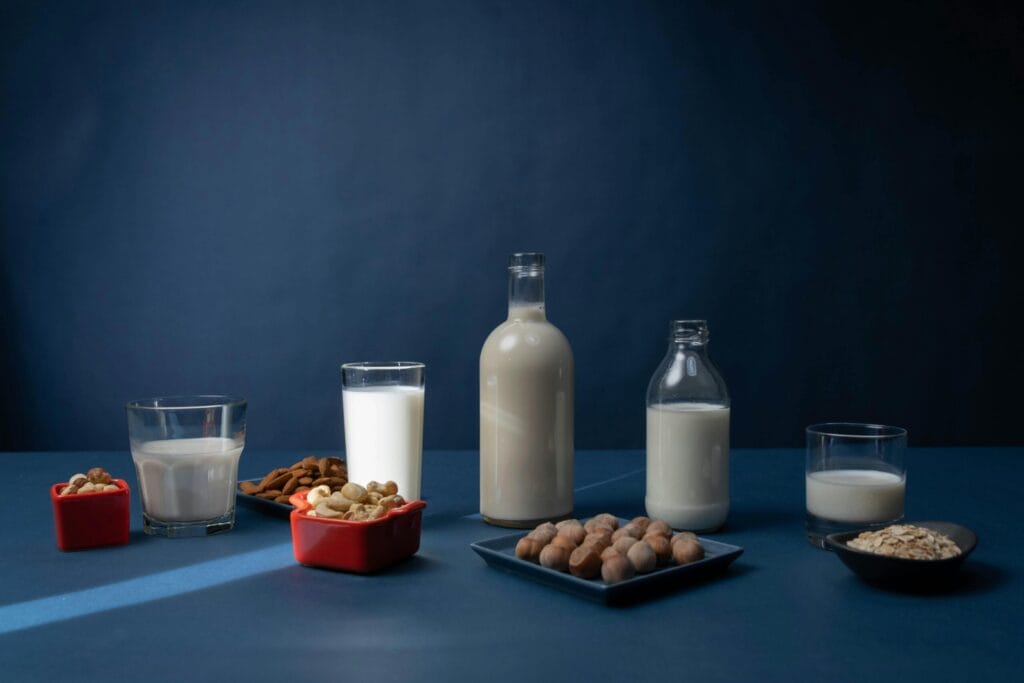
Plant-Based Beverages
Three plant-based milks with fundamentally different nutritional profiles despite occupying the same “dairy alternative” market position. Cross-table analysis makes clear: none is a complete dairy substitute. The right choice depends on which nutrients the consumer specifically needs — and which gaps they can address through other dietary sources or supplementation.
Soy Milk (unsweetened)
Most dairy-equivalent on Table 1 protein (3.3 g, matching whole milk’s 3.2 g). Table 4 minerals are uniquely strong: iron 0.50 mg (highest of any plant milk and higher than all juices), magnesium 25 mg (matching coconut water), selenium 3.4 µg (matching dairy). Critical gap across all three plant milks: Table 3 B12 = 0.00 µg (unfortified) versus dairy’s 0.44–0.45 µg — non-negotiable supplementation for vegetarians. Table 5 isoflavones (genistein 12 + daidzein 8 mg/100 ml) — a 240 ml serving provides ~48 mg, within the range for modest LDL reduction in meta-analyses.
Almond Milk (commercial, unsweetened)
Nutritionally paradoxical across the five tables. Table 1 protein: 0.6 g — 18% of dairy, the lowest of any milk product in this dataset. Table 3 B12: 0.00 µg. Yet Table 3 vitamin E is 6.5 mg/100 ml — the single highest value across all 40 beverages, 43× whole milk. A 240 ml serving provides 15.6 mg vitamin E, exceeding the adult RDA of 15 mg. For individuals specifically requiring high vitamin E at minimum calories (15 kcal/100 ml), almond milk has a unique and valid case. The calcium of 188 mg/100 ml (Table 4) is fortification-derived — naturally occurring calcium in the almond base is largely lost in commercial dilution.
Oat Milk (commercial)
Nutritional distinction: vitamin D 1.5 µg/100 ml (Table 3 — highest of any plant milk), calcium 120 mg (Table 4, matched to dairy), and beta-glucan 0.3 g/100 ml (Table 5). Beta-glucan is the soluble fiber with FDA and EFSA qualified health claims for LDL cholesterol reduction at 3 g/day — a 240 ml serving provides 0.72 g, building toward this therapeutic threshold. Avenanthramides, anti-inflammatory polyphenols unique to oats, are the only such bioactive class in this dataset. Table 1 carbohydrate (7.0 g/100 ml) is highest among the three plant milks, making it less suitable for low-carbohydrate diets.
FAQ — Beverage Nutrition
Q1. Which beverage has the most antioxidants?
Espresso leads all 40 drinks with an ORAC of 7,860 µmol TE/100 ml — far above green tea (1,253) or any fruit juice. Among juices, pomegranate juice ranks highest (ORAC 2,341). The common belief that green tea is the top antioxidant drink is not supported by this data — coffee is significantly higher.
Q2. Is coconut water better than a sports drink for hydration?
For everyday hydration, yes. Coconut water has more potassium (250 mg vs 38 mg/100 ml), more magnesium, and natural electrolytes at only 19 kcal/100 ml. Commercial sports drinks add 26.5 g sugar per 500 ml with no extra benefit unless you are exercising intensely for 60+ minutes. Traditional chaas (buttermilk) is also excellent — higher in sodium, protein, and calcium than both.
Q3. Can fruit juice be counted as healthy?
It depends on the juice. Fresh orange juice (Vitamin C 50 mg, folate 30 µg) and pomegranate juice (polyphenols 450 mg) deliver genuine nutritional value. Tomato juice is the best choice — very low sugar (2.6 g/100 ml) with lycopene, potassium, and vitamins. Apple juice has the weakest nutrient profile of any juice with high sugar and minimal return. WHO classifies all juice sugar as free sugar, the same as added sugar — portion size always matters.
Q4. Which plant milk is best for vegetarians replacing dairy?
Soy milk is the closest match to dairy — 3.3 g protein per 100 ml (equal to whole milk) plus iron, magnesium, and selenium. However, none of the three plant milks contains B12 (unless fortified), which is the most critical nutrient for vegetarians. B12 must be supplemented separately. Almond milk excels only in Vitamin E; oat milk leads on Vitamin D and beta-glucan fiber. No single plant milk fully replaces all of dairy’s functions.
Q5. How much sugar is too much from drinks alone?
WHO recommends a daily free-sugar limit of 25 g. Many common beverages exceed this in a single serving: a 355 ml cola can has 37.6 g, lemon-lime soda 38.7 g, sweet lassi (250 ml) 28.8 g, and hot chocolate (240 ml) 27.6 g. Even fresh orange juice (240 ml) provides 26 g. Zero-sugar options — black tea, green tea, espresso, unsweetened coconut water, and ORS — are the safest choices for blood sugar management.
Data Sources & References
- IFCT 2017: Longvah T, Ananthan R, Bhaskarachary K, Venkaiah K. Indian Food Composition Tables 2017. NIN-ICMR, Hyderabad. Primary source for all Indian-origin beverages.
- USDA FDC: U.S. Dept. of Agriculture, ARS. FoodData Central 2024 — SR Legacy & Foundation Foods. fdc.nal.usda.gov
- Phenol-Explorer v3.6: Rothwell JA et al. Phenol-Explorer: online comprehensive database on polyphenol contents in foods. phenol-explorer.eu. Source: polyphenol, EGCG, catechin, ORAC data.
- WHO/FAO 2004: Vitamin and mineral requirements in human nutrition, 2nd edition. WHO Joint Expert Consultation, Geneva.
- NIN Dietary Guidelines 2024: Dietary Guidelines for Indians. National Institute of Nutrition, ICMR, Hyderabad.
- FNDDS 2021–23: Food & Nutrient Database for Dietary Studies. USDA ARS, Beltsville Human Nutrition Research Center.
- WHO ORS 2006: Oral Rehydration Salts: production of the new ORS. WHO/FCH/CAH/06.1. Geneva.
- USDA Carotenoid DB: Bhagwat S, Haytowitz DB. USDA Database for the Carotenoid Content of Selected Foods, Release 3. 2014.
- FSSAI: Food Safety and Standards Authority of India. Standards for Beverages, Milk Products, Food Additives. fssai.gov.in
- McCance & Widdowson CoFID: Composition of Foods Integrated Dataset 2021. Public Health England.
- Soy isoflavones: Messina M. Soy and Health Update. Nutrients. 2016;8(12):754.
- Pomegranate: Basu A, Penugonda K. Pomegranate juice: a heart-healthy fruit juice. Nutr Rev. 2009;67(1):49–56.
Disclaimer: All values are mean/representative figures for standard preparations. Natural variation ±10–20% is inherent in food composition data. For research or clinical applications, verify against current IFCT 2017 and USDA FoodData Central editions. Fortification levels in commercial plant milks vary by brand — always check product labels. This is for educational purposes and does not constitute clinical dietary advice.
Explore more,
Nutritional value and recommended intake of Fruits
Nutritional value and recommended intake of Milk and Milk products