
Non-Vegetarian Foods
Complete Nutrition Facts & Health Benefits
Meat · Poultry · Fish · Seafood · Eggs | 60 Foods · Macros + Vitamins + Minerals + Per Serving
Introduction
Our 60+ best Meat, Fish, and Eggs Nutrition Facts guide provides a complete protein nutrition database across 11 categories. Every food listed includes a full breakdown of macros, micronutrients, and RDA (Recommended Dietary Allowance). Whether you are doing a high protein food comparison or checking the micronutrients in animal proteins, our data is designed to help you meet your RDA of protein and vitamins with precision.
Food is far more than just fuel. The choices we make about what we eat — how much protein we consume, which fats we include, which vitamins and minerals we prioritise — have a profound and measurable impact on our energy, immunity, hormonal balance, cardiovascular health, cognitive function, and longevity. Among all food groups, non-vegetarian foods — meat, poultry, fish, seafood, and eggs — are some of the most nutritionally concentrated options available to humans.
This is not a new discovery. Archaeological and anthropological evidence consistently shows that the inclusion of animal-source foods — particularly meat, fish, and eggs — was a major driver of human brain development over hundreds of thousands of years. The dense concentrations of protein, B12, haem iron, omega-3 fatty acids (EPA & DHA), zinc, and Vitamin D found in animal foods supported the growth of the human brain and the complexity of human cognition in ways that plant foods alone could not.
Today, with access to global nutrition science, we understand precisely what makes each non-vegetarian food valuable — and how to make the most of it. A chicken breast is not just ‘protein’ — it is a source of Niacin (B3) for energy metabolism, Vitamin B6 for neurotransmitters, phosphorus for ATP production, and selenium for antioxidant defence. A sardine is not just a cheap fish — it is one of the richest sources of calcium, omega-3s, Vitamin D, and B12 in a single food. An egg yolk is not just fat — it is a concentrated depot of Vitamins A, D, E, K, choline, folate, and lutein.
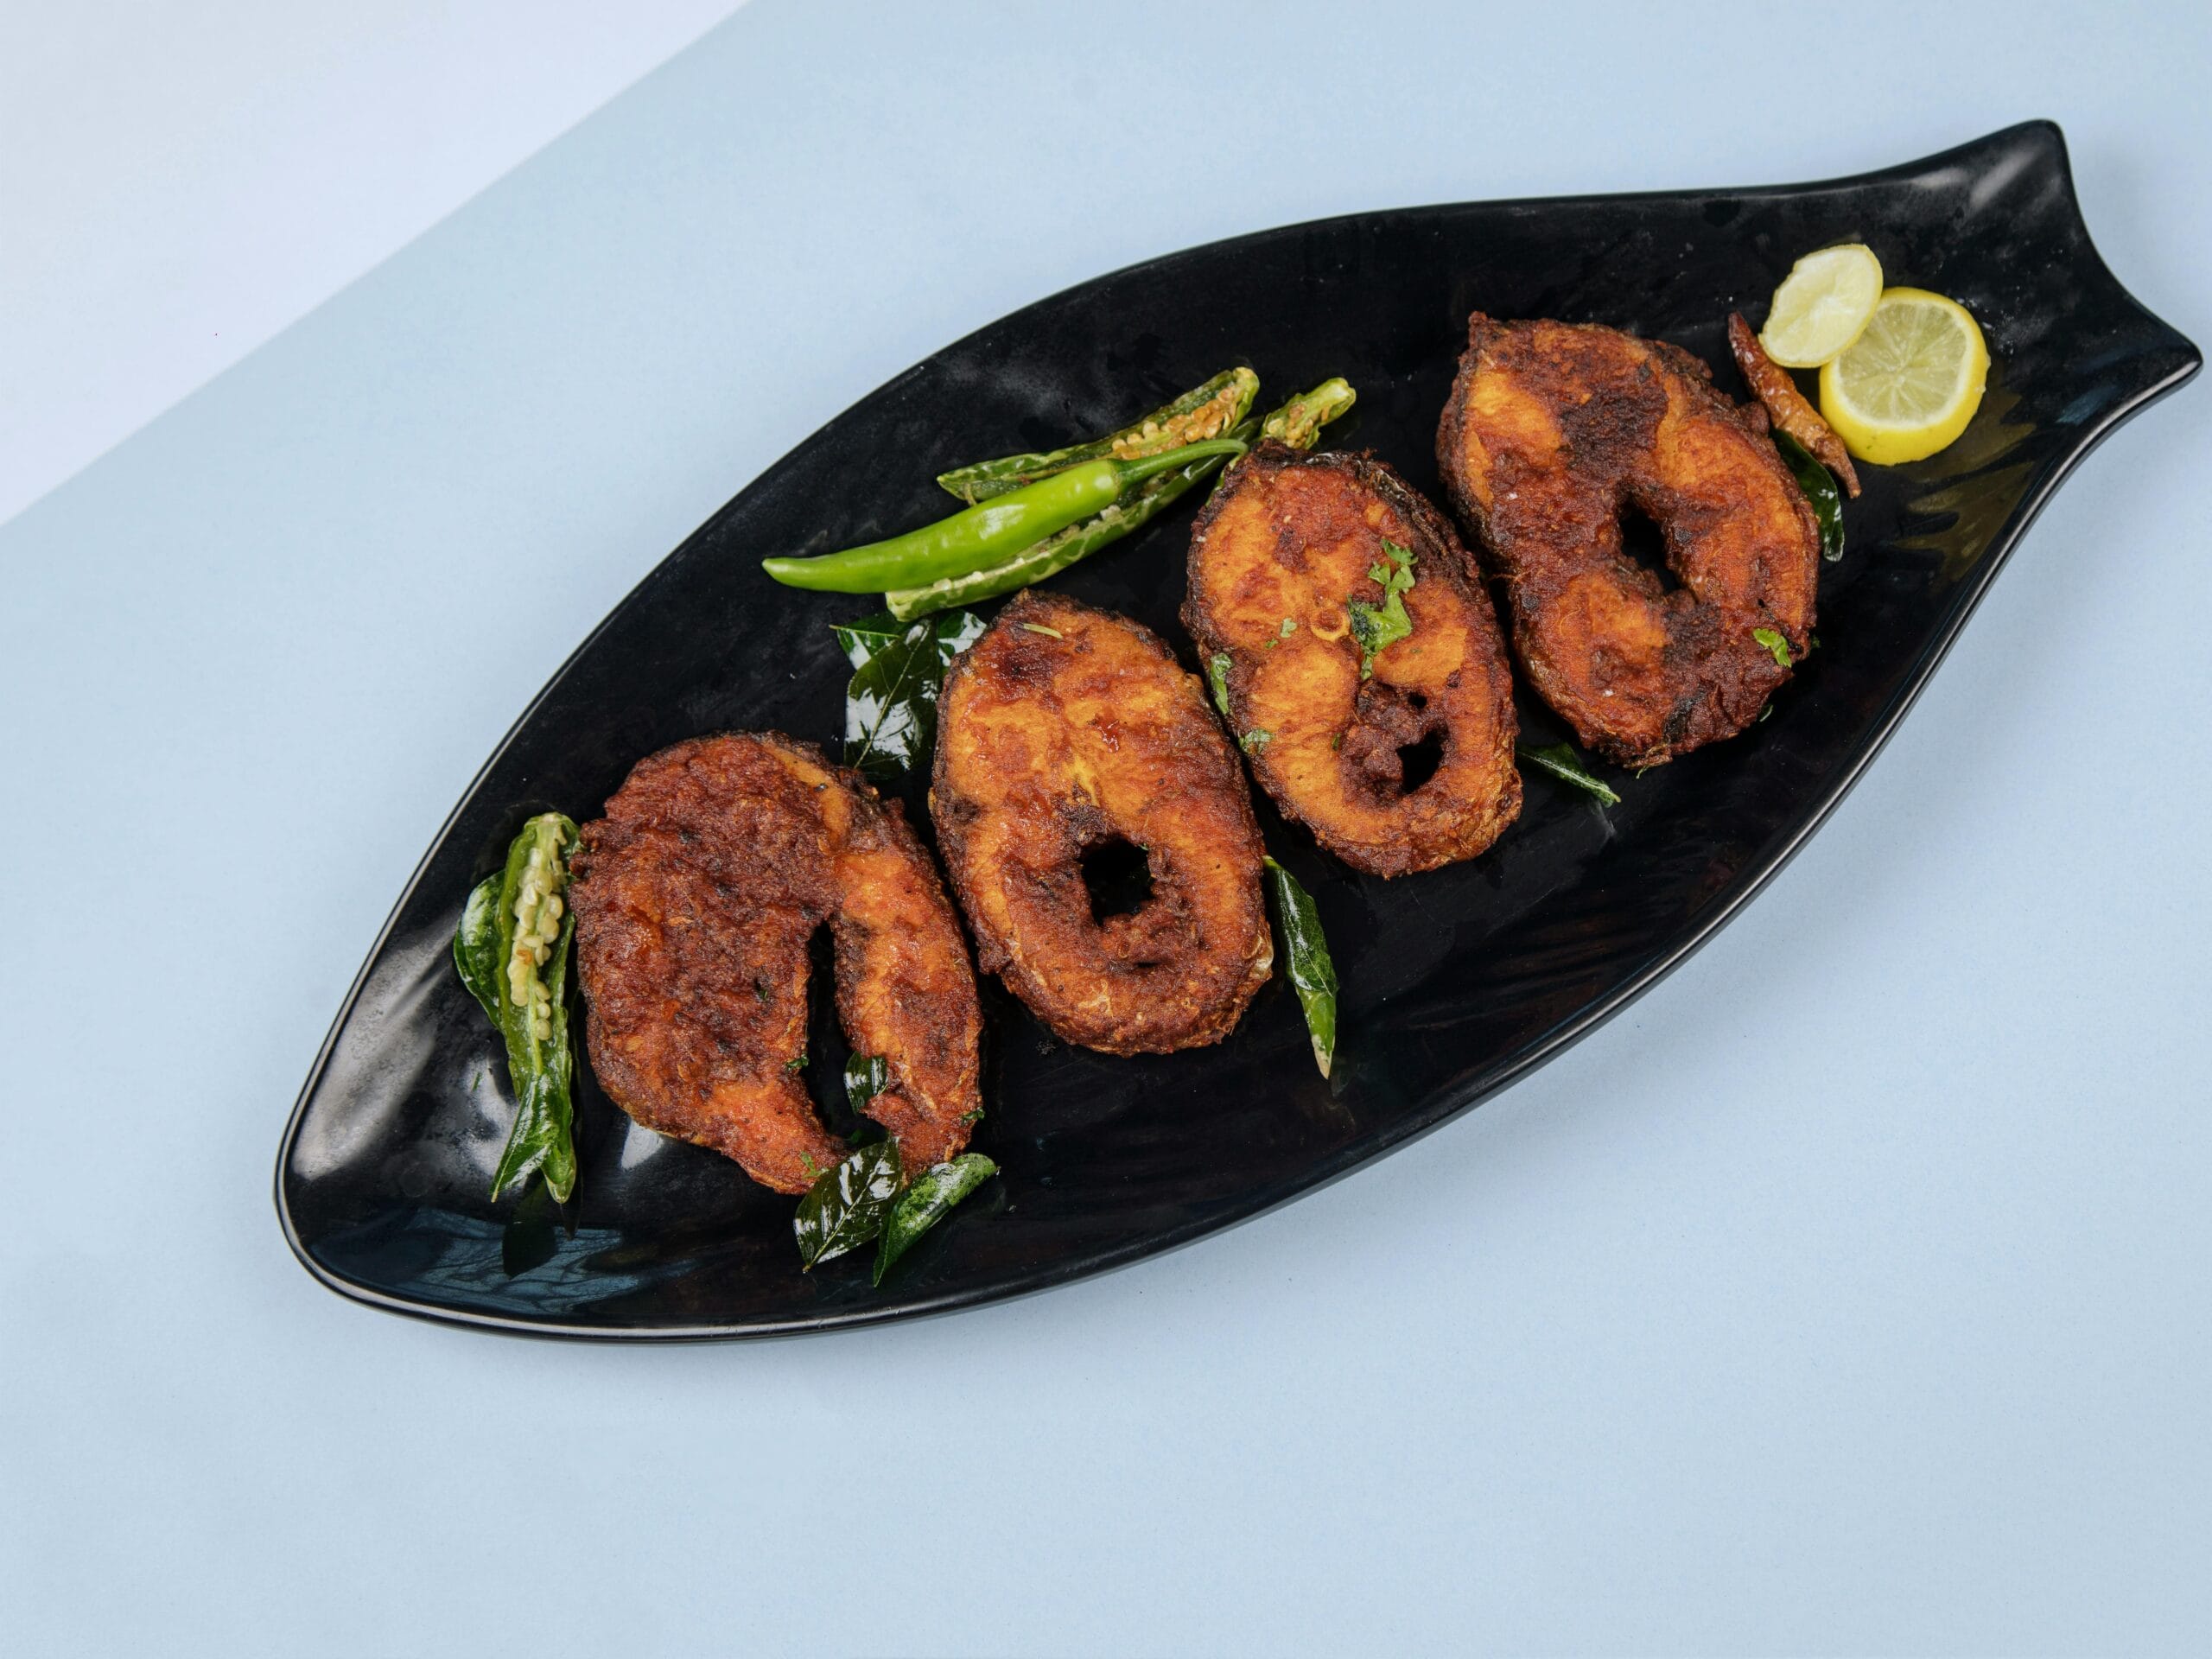
India has a rich and diverse non-vegetarian culinary tradition. From Bengal’s mustard-marinated Hilsa and Rohu curries, to Goa’s coconut fish curries and pork vindaloo, to Hyderabad’s biryani and Chettinad’s pepper chicken, to Kerala’s karimeen and prawn preparations — the range of non-vegetarian cooking across the subcontinent is extraordinary. Yet despite this richness, nutrition literacy around these foods — understanding what is actually in what we eat, and in what quantities — remains relatively low.
Why Non-Vegetarian Foods Are Nutritionally Significant
Non-vegetarian foods — meat, poultry, fish, seafood, and eggs — are among the most nutrient-dense food groups on the planet. Unlike plant foods, they provide complete proteins — meaning they contain all nine essential amino acids the human body cannot synthesise on its own — in a single, readily digestible source.
Beyond protein, they are the only reliable dietary sources of Vitamin B12, the primary form of haem iron (which is absorbed 2–3 times more efficiently than non-haem iron from plants), long-chain omega-3 fatty acids (EPA & DHA), and significant quantities of zinc, selenium, Vitamin D, and Vitamin A.
In India, non-vegetarian foods are consumed by over 70% of the population and are central to the cuisines of nearly every region — from Hilsa and Rohu fish curries in Bengal and Odisha, to Mutton Rogan Josh in Kashmir, Chicken Chettinad in Tamil Nadu, and prawn and crab preparations along the coastal states. Understanding their nutritional composition allows individuals to make better, more informed dietary choices.
💡 A 150 g serving of skinless chicken breast delivers ~46 g of protein — nearly an adult’s full daily requirement — with only ~250 kcal and just 5 g of fat. This makes it one of the most protein-efficient foods available.
How to Read This Resource
This article is structured in the following data sections:
- Section 3: Category Average Nutrition — a summary table comparing all 11 food groups side by side.
- Section 4: Macronutrients (per 100 g) — calories, protein, fat, saturated fat, carbohydrates, fibre, and cholesterol for all 60 foods.
- Section 5: Vitamins (per 100 g) — Vitamin A, D, B12, Niacin (B3), B6, and Folate for all 60 foods.
- Section 6: Minerals (per 100 g) — Iron, Zinc, Calcium, Potassium, Selenium, and Sodium for all 60 foods.
- Section 7: Per Serving Nutrition — real-world portion sizes (e.g., 1 egg, 1 medium fish fillet, 1 piece of chicken) with all key nutrients scaled to that serving.
- Sections 8–11: Key nutrients, category deep-dives, ICMR/WHO guidelines, and diet tips.
All raw-data values are for uncooked food per 100 g unless specified. Cooking methods alter nutrient content — particularly fat (frying adds oil), water content (grilling reduces weight), and some heat-sensitive vitamins. Use raw values as a baseline for comparison; use the Per Serving section for real-world portion-level understanding.
Important: Nutrient values are based on standard reference databases and represent the best available averages. Values can vary with animal breed, age, feed, geographic origin, and exact cut or preparation.
Category Average Nutrition (per 100 g, Raw)
The table below shows the average nutritional values calculated across all foods within each category in this database. It is designed as a quick comparison tool — allowing you to see at a glance which food groups are richest in protein, vitamins, or minerals.
Note that averages can be skewed by outliers within a category. For example, Chicken Liver has extraordinarily high Vitamin B12 (16.6 µg) and iron (8.5 mg) compared to other chicken cuts, so the category average appears higher than a typical chicken breast or thigh would suggest. Similarly, Pork Belly and Bacon inflate the pork category’s fat and calorie averages significantly above lean pork cuts like tenderloin.
| MACRONUTRIENTS | VITAMINS | MINERALS | ||||||||||||||||
|---|---|---|---|---|---|---|---|---|---|---|---|---|---|---|---|---|---|---|
| Category | Calories (kcal) | Protein (g) | Total Fat (g) | Sat. Fat (g) | Fiber (g) | Cholesterol (mg) | Vit A (µg) | Vit D (µg) | Vit B12 (µg) | Niacin B3 (mg) | Vit B6 (mg) | Folate (µg) | Iron (mg) | Zinc (mg) | Calcium (mg) | Potassium (mg) | Selenium (µg) | Sodium (mg) |
| 🐷 Pork | 350.0 | 21.3 | 28.5 | 10.0 | 0.0 | 82.4 | 2.6 | 0.5 | 0.6 | 6.0 | 0.4 | 2.2 | 0.9 | 1.9 | 7.4 | 371.4 | 29.5 | 646.0 |
| 🦐 Shrimp/Prawns | 94.3 | 21.4 | 0.8 | 0.2 | 0.0 | 162.7 | 29.7 | 0.0 | 1.2 | 2.6 | 0.1 | 13.3 | 0.4 | 1.2 | 59.0 | 221.3 | 39.7 | 154.0 |
| 🥚 Eggs | 169.2 | 13.0 | 12.0 | 3.7 | 0.0 | 593.0 | 169.8 | 2.4 | 1.8 | 0.1 | 0.2 | 64.5 | 2.2 | 1.3 | 60.7 | 148.3 | 32.5 | 127.8 |
| 🐟 Freshwater Fish | 135.7 | 19.2 | 6.0 | 1.7 | 0.0 | 58.7 | 21.8 | 6.3 | 2.6 | 3.4 | 0.2 | 13.0 | 1.1 | 0.9 | 335.0 | 329.7 | 32.7 | 60.8 |
| 🐔 Chicken | 179.9 | 22.6 | 9.3 | 2.6 | 0.0 | 139.9 | 487.7 | 0.4 | 2.6 | 7.7 | 0.5 | 88.0 | 2.0 | 2.1 | 10.9 | 229.7 | 27.0 | 79.9 |
| 🐑 Lamb | 231.8 | 23.6 | 14.8 | 6.1 | 0.0 | 90.2 | 0.0 | 0.1 | 2.7 | 6.3 | 0.2 | 22.5 | 1.7 | 4.4 | 13.5 | 307.0 | 24.9 | 70.0 |
| 🐠 Marine Fish | 129.2 | 20.2 | 5.0 | 1.1 | 0.0 | 63.6 | 22.2 | 5.5 | 3.2 | 5.4 | 0.4 | 8.1 | 1.1 | 0.7 | 133.9 | 337.3 | 38.1 | 204.7 |
| 🦀 Crab/Lobster | 85.3 | 18.0 | 0.9 | 0.2 | 0.0 | 81.7 | 9.0 | 0.2 | 5.4 | 2.5 | 0.1 | 30.7 | 0.3 | 3.9 | 88.3 | 330.3 | 41.3 | 332.0 |
| 🦑 Other Seafood | 83.4 | 13.3 | 1.6 | 0.3 | 0.0 | 79.0 | 23.2 | 0.0 | 11.9 | 1.6 | 0.1 | 18.0 | 3.0 | 4.8 | 40.2 | 299.2 | 46.7 | 196.6 |
| 🐐 Mutton/Goat | 221.0 | 19.4 | 15.3 | 6.4 | 0.0 | 140.0 | 1316.4 | 0.3 | 14.9 | 7.4 | 0.2 | 58.2 | 3.3 | 3.8 | 8.6 | 296.6 | 17.7 | 72.8 |
| 🐄 Beef | 212.2 | 24.2 | 11.6 | 4.6 | 0.0 | 162.2 | 1242.0 | 0.4 | 19.5 | 7.8 | 0.4 | 71.0 | 3.2 | 4.5 | 10.8 | 322.5 | 25.2 | 66.5 |
| 📊 Daily RDA (Adult avg) | ~2000 | 50–60g | <65g | <20g | 25–30g | <300mg | 700–900µg | 15–20µg | 2.4µg | 14–16mg | 1.3mg | 400µg | 8–18mg | 8–11mg | 1000mg | 2600mg | 55µg | <2300mg |
Compare each row against the Daily RDA reference row above to gauge how a 100 g serving contributes to your daily nutritional needs.
Key Observations from the Averages
Highest Protein: Shrimp/Prawns (21.4 g avg) — very lean, near-zero fat — exceptional protein-to-calorie ratio
Highest Cholesterol: Eggs (593 mg avg) — driven primarily by egg yolk — egg white has 0 mg cholesterol
Richest Vit D: Marine Fish (5.4 µg avg) — Mackerel leads at 16.1 µg — best dietary Vit D source
Best Vit B12: Crab/Lobster (5.4 µg avg) — Blue Crab provides 7.6 µg — far exceeds the 2.4 µg RDA
Highest Iron: Chicken avg (2.1 mg) — Chicken liver alone hits 8.5 mg — key for anaemia prevention
Best Zinc: Crab/Lobster (3.9 mg avg) — Oyster (in Other Seafood) provides 16.6 mg — highest of any food
Richest Calcium: Freshwater Fish (302 mg avg) — Rohu 650 mg, Singhi 580 mg — from edible small bones
Selenium Champion: Other Seafood (46.5 µg avg) — Oyster 77 µg, Tuna canned 75.6 µg — top two sources
Macronutrients — Complete Table (per 100 g, Raw)
Understanding the Macro Columns
Calories (kcal): Total energy provided per 100 g. Lean meats and most fish range from 82–209 kcal. Pork belly (518 kcal) and bacon (541 kcal) are the highest due to extreme fat content. Egg yolk is energy-dense at 322 kcal/100g despite being a small volume.
Protein (g): All non-vegetarian foods are high-quality complete protein sources. Tuna (canned, 25.5 g), chicken breast (31 g), and lamb leg (28 g) lead. Even seemingly “lower” protein items like oyster (7.1 g) provide all essential amino acids in a complete profile.
Total Fat (g): Ranges from 0.3 g (cooked shrimp) to 53 g (pork belly). Fat type matters more than total fat — salmon’s fat is mostly heart-healthy omega-3s, while pork belly’s fat is predominantly saturated.
Saturated Fat (g): The fraction of fat that raises LDL cholesterol. Keep below 20 g/day (ICMR). Pork belly (19.3 g sat fat/100g) and mutton ribs (10.2 g) are the highest. Lean fish like cod (0.1 g) and tuna (0.1 g) are the lowest.
Carbohydrates (g): Near zero for all meats, poultry, and most fish. Small amounts appear in shellfish: oyster (3.9 g), mussels (3.7 g), squid (3.1 g) — from glycogen stored in the tissue. This is nutritionally negligible.
Dietary Fiber (g): Zero across all entries. This is nutritionally accurate — animal muscle tissue contains no dietary fibre. Dietary fibre must be obtained from plant foods (vegetables, fruits, whole grains, legumes).
Cholesterol (mg): Dietary cholesterol has less impact on blood cholesterol than saturated fat for most people (ICMR 2020, AHA guidelines). Egg yolk (1085 mg), duck egg (884 mg), and quail egg (844 mg) are highest. Most fish and lean meats are moderate (40–100 mg). Liver cuts are high due to the liver’s role in cholesterol metabolism.
| Food Item | Category | Calories (kcal) | Protein (g) | Total Fat (g) | Sat. Fat (g) | Carbs (g) | Fiber (g) | Cholesterol (mg) |
|---|---|---|---|---|---|---|---|---|
| Bacon (pan-fried) | Pork | 541 | 37.0 | 42.0 | 14.4 | 1.4 | 0.0 | 110 |
| Chicken Breast (skinless) | Chicken | 165 | 31.0 | 3.6 | 1.0 | 0.0 | 0.0 | 85 |
| Lamb Leg (lean) | Lamb | 191 | 28.0 | 8.3 | 3.1 | 0.0 | 0.0 | 85 |
| Beef Liver | Beef | 175 | 26.4 | 5.0 | 1.9 | 5.1 | 0.0 | 389 |
| Beef Sirloin (lean) | Beef | 207 | 26.2 | 10.6 | 4.1 | 0.0 | 0.0 | 89 |
| Tuna (canned in water) | Marine Fish | 116 | 25.5 | 0.8 | 0.2 | 0.0 | 0.0 | 46 |
| Sardine | Marine Fish | 208 | 24.6 | 11.5 | 1.5 | 0.0 | 0.0 | 142 |
| Chicken Thigh (skinless) | Chicken | 179 | 24.5 | 8.3 | 2.3 | 0.0 | 0.0 | 93 |
| Lamb Chop (lean) | Lamb | 258 | 24.5 | 17.3 | 7.3 | 0.0 | 0.0 | 97 |
| Beef Ribeye | Beef | 291 | 24.4 | 20.8 | 8.7 | 0.0 | 0.0 | 95 |
| Tuna (yellowfin, raw) | Marine Fish | 109 | 24.4 | 0.5 | 0.1 | 0.0 | 0.0 | 49 |
| Chicken Drumstick (skinless) | Chicken | 172 | 24.2 | 8.0 | 2.1 | 0.0 | 0.0 | 87 |
| Cooked Shrimp | Shrimp/Prawns | 99 | 23.7 | 0.3 | 0.1 | 0.0 | 0.0 | 189 |
| Pork Chop (lean) | Pork | 209 | 23.6 | 12.3 | 4.2 | 0.0 | 0.0 | 78 |
| Seer Fish / Vanjaram | Marine Fish | 114 | 22.5 | 2.8 | 0.7 | 0.0 | 0.0 | 56 |
| Chicken Wings (with skin) | Chicken | 266 | 22.4 | 18.8 | 5.3 | 0.0 | 0.0 | 96 |
| Chicken Leg (with skin) | Chicken | 215 | 22.0 | 13.5 | 3.7 | 0.0 | 0.0 | 91 |
| Hilsa / Ilish | Freshwater Fish | 273 | 21.8 | 19.4 | 5.3 | 0.0 | 0.0 | 77 |
| Lamb Shoulder | Lamb | 253 | 21.8 | 17.8 | 7.5 | 0.0 | 0.0 | 91 |
| Pork Tenderloin (lean) | Pork | 143 | 21.7 | 5.6 | 1.9 | 0.0 | 0.0 | 73 |
| Trout (rainbow) | Freshwater Fish | 150 | 21.5 | 6.6 | 1.9 | 0.0 | 0.0 | 59 |
| Mutton/Goat Leg | Mutton/Goat | 218 | 20.5 | 14.6 | 6.1 | 0.0 | 0.0 | 75 |
| Mutton/Goat Liver | Mutton/Goat | 143 | 20.5 | 5.3 | 1.8 | 3.8 | 0.0 | 389 |
| Salmon (Atlantic) | Marine Fish | 208 | 20.4 | 13.4 | 3.1 | 0.0 | 0.0 | 63 |
| Nethili / Anchovies | Marine Fish | 131 | 20.4 | 4.8 | 1.3 | 0.0 | 0.0 | 85 |
| Tiger Prawn / Jhinga | Shrimp/Prawns | 99 | 20.3 | 1.4 | 0.3 | 0.2 | 0.0 | 152 |
| Tilapia | Freshwater Fish | 96 | 20.1 | 1.7 | 0.6 | 0.0 | 0.0 | 50 |
| Rawas / Indian Salmon | Marine Fish | 127 | 20.1 | 4.9 | 1.2 | 0.0 | 0.0 | 58 |
| White Shrimp (raw) | Shrimp/Prawns | 85 | 20.1 | 0.6 | 0.2 | 0.0 | 0.0 | 147 |
| Beef (90% lean mince) | Beef | 176 | 20.0 | 10.0 | 3.8 | 0.0 | 0.0 | 76 |
| Lamb Mince (lean) | Lamb | 225 | 20.0 | 15.7 | 6.5 | 0.0 | 0.0 | 88 |
| Surmai / Kingfish | Marine Fish | 100 | 19.8 | 2.2 | 0.7 | 0.0 | 0.0 | 54 |
| Mutton/Goat Shoulder | Mutton/Goat | 234 | 19.8 | 16.5 | 7.0 | 0.0 | 0.0 | 78 |
| Catla (Indian carp) | Freshwater Fish | 111 | 19.0 | 3.5 | 0.9 | 0.0 | 0.0 | 58 |
| Lobster (raw) | Crab/Lobster | 89 | 18.8 | 0.9 | 0.2 | 0.5 | 0.0 | 95 |
| Mackerel / Bangda | Marine Fish | 205 | 18.6 | 13.9 | 3.3 | 0.0 | 0.0 | 75 |
| Mutton/Goat Ribs | Mutton/Goat | 292 | 18.2 | 24.0 | 10.2 | 0.0 | 0.0 | 82 |
| Blue Crab (raw) | Crab/Lobster | 87 | 18.1 | 1.1 | 0.2 | 0.0 | 0.0 | 78 |
| Pomfret / Paplet | Marine Fish | 99 | 18.0 | 3.0 | 0.9 | 0.0 | 0.0 | 52 |
| Mutton/Goat Keema (lean) | Mutton/Goat | 218 | 17.9 | 16.0 | 6.7 | 0.0 | 0.0 | 76 |
| Cod (Atlantic) | Marine Fish | 82 | 17.8 | 0.7 | 0.1 | 0.0 | 0.0 | 43 |
| Chicken Mince (lean) | Chicken | 143 | 17.4 | 8.1 | 2.2 | 0.0 | 0.0 | 88 |
| Mud Crab / Kekda | Crab/Lobster | 80 | 17.1 | 0.8 | 0.2 | 0.0 | 0.0 | 72 |
| Rohu (Labeo rohita) | Freshwater Fish | 97 | 17.1 | 2.7 | 0.7 | 0.0 | 0.0 | 55 |
| Chicken Liver | Chicken | 119 | 16.9 | 4.8 | 1.6 | 0.9 | 0.0 | 439 |
| Scallop | Other Seafood | 88 | 16.8 | 0.8 | 0.1 | 2.4 | 0.0 | 33 |
| Singhi (walking catfish) | Freshwater Fish | 87 | 16.0 | 2.3 | 0.6 | 0.0 | 0.0 | 53 |
| Egg Yolk | Eggs | 322 | 15.9 | 26.5 | 8.7 | 3.6 | 0.0 | 1085 |
| Squid / Calamari | Other Seafood | 92 | 15.6 | 1.4 | 0.4 | 3.1 | 0.0 | 233 |
| Octopus | Other Seafood | 82 | 14.9 | 1.0 | 0.2 | 2.2 | 0.0 | 48 |
| Pork Sausage (fresh) | Pork | 339 | 14.9 | 29.8 | 10.4 | 2.0 | 0.0 | 79 |
| Quail Egg | Eggs | 158 | 13.1 | 11.1 | 3.6 | 0.4 | 0.0 | 844 |
| Duck Egg | Eggs | 185 | 12.8 | 13.8 | 3.7 | 1.5 | 0.0 | 884 |
| Whole Egg (hen) | Eggs | 143 | 12.6 | 9.5 | 3.1 | 0.7 | 0.0 | 372 |
| Hard-Boiled Egg | Eggs | 155 | 12.6 | 10.6 | 3.3 | 1.1 | 0.0 | 373 |
| Mussels | Other Seafood | 86 | 11.9 | 2.2 | 0.4 | 3.7 | 0.0 | 28 |
| Egg White | Eggs | 52 | 10.9 | 0.2 | 0.0 | 0.7 | 0.0 | 0 |
| Bombil / Bombay Duck | Marine Fish | 52 | 10.3 | 0.9 | 0.2 | 0.0 | 0.0 | 40 |
| Pork Belly | Pork | 518 | 9.3 | 53.0 | 19.3 | 0.0 | 0.0 | 72 |
| Oyster | Other Seafood | 69 | 7.1 | 2.5 | 0.6 | 3.9 | 0.0 | 53 |
Macro Notes: Fiber = 0 for all meats and seafood — nutritionally correct; animal muscle contains no dietary fiber. Liver cuts (Chicken 439 mg, Goat 389 mg, Beef 389 mg) are high in cholesterol — limit to 1–2 servings/week. Pork Belly (518 kcal, 53g fat) and Bacon (541 kcal, 42g fat) are very calorie-dense. Egg Yolk contains most of the egg’s cholesterol (1085 mg/100g); Egg White = 0 mg. Shrimp and squid contain moderate cholesterol but are very low in fat, making their cardiovascular impact minimal for most people.
Vitamins — Complete Table (per 100 g, Raw)
Vitamins are essential micronutrients required in small amounts for virtually every biological process — from energy metabolism and nerve function to immune defence, vision, and cell division. Non-vegetarian foods are the primary or only dietary source of several critical vitamins, particularly Vitamin B12 and Vitamin D.
Understanding the Vitamin Columns
Vitamin A (µg RAE): Retinol Activity Equivalents — the bioavailable form of Vitamin A found only in animal foods (as retinol). Critical for vision, immune function, skin integrity, and reproduction. Animal liver is by far the richest source — Goat liver (6,582 µg) and Beef liver (4,968 µg) provide 7–9× the adult daily RDA in a single 100 g serving. Egg yolk (381 µg), salmon (50 µg), and duck egg (184 µg) are other meaningful sources.
Vitamin D (µg): The ‘sunshine vitamin’ — few foods provide significant dietary Vitamin D, making non-vegetarian foods (particularly fatty fish) critically important, especially in populations with limited sun exposure. Mackerel/Bangda leads at 16.1 µg, followed by Trout (13.6 µg), Salmon (11.1 µg), and Rawas (6.5 µg). Indian freshwater fish are also notable — Rohu provides 5.0 µg, Catla 5.5 µg. The RDA is 15–20 µg/day; eating fish 2–3 times per week can help meet this.
Vitamin B12 (µg): Cobalamin — found exclusively in animal foods. There is no plant-based source of B12 (seaweed and fermented foods contain analogues, not true B12). Deficiency causes irreversible nerve damage, anaemia, and cognitive decline. The RDA is only 2.4 µg/day, but liver and certain shellfish contain extraordinarily high amounts: Goat liver (65.0 µg), Beef liver (70.7 µg), Chicken liver (16.6 µg), Octopus (36.0 µg), Blue Crab (7.6 µg). Even modest fish and egg consumption covers this requirement easily.
Niacin / B3 (mg): Essential for energy metabolism, DNA repair, and nervous system health. Chicken breast (13.7 mg), tuna raw (10.5 mg), and mackerel (9.1 mg) are the top sources. RDA is 14–16 mg NE/day.
Vitamin B6 (mg): Pyridoxine — involved in protein metabolism, neurotransmitter synthesis, and immune function. Chicken breast (0.90 mg), salmon (0.80 mg), and tuna (0.90 mg) are rich sources. RDA is ~1.3 mg/day. Important for people on high-protein diets.
Folate (µg): Critical for DNA synthesis and cell division, especially during pregnancy. Liver is the champion: Chicken liver provides 578 µg per 100g (145% of the daily RDA), Beef liver 260 µg, Goat liver 280 µg. Shellfish (crab, mussels) also contribute meaningfully.
| Food Item | Category | Vit A (µg RAE) | Vit D (µg) | Vit B12 (µg) | Vit B2 / Riboflavin (mg) | Vit B3 / Niacin (mg) | Vit B6 (mg) | Folate (µg) | Vit C (mg) |
|---|---|---|---|---|---|---|---|---|---|
| Beef (90% lean mince) | Beef | 0 | 0.1 | 2.4 | 0.2 | 5.5 | 0.4 | 9 | 0 |
| Beef Sirloin (lean) | Beef | 0 | 0.1 | 2.8 | 0.2 | 5.8 | 0.4 | 8 | 0 |
| Beef Ribeye | Beef | 0 | 0.1 | 2.2 | 0.2 | 5.4 | 0.3 | 7 | 0 |
| Beef Liver | Beef | 4968 | 1.1 | 70.7 | 2.8 | 14.4 | 0.7 | 260 | 1 |
| Chicken Breast (skinless) | Chicken | 9 | 0.1 | 0.3 | 0.1 | 13.7 | 0.9 | 5 | 0 |
| Chicken Thigh (skinless) | Chicken | 22 | 0.1 | 0.3 | 0.2 | 5.6 | 0.4 | 7 | 0 |
| Chicken Leg (with skin) | Chicken | 25 | 0.1 | 0.3 | 0.2 | 6.1 | 0.4 | 8 | 0 |
| Chicken Wings (with skin) | Chicken | 29 | 0.1 | 0.4 | 0.1 | 6.5 | 0.5 | 5 | 0 |
| Chicken Drumstick (skinless) | Chicken | 21 | 0.1 | 0.3 | 0.2 | 5.8 | 0.4 | 7 | 0 |
| Chicken Liver | Chicken | 3296 | 2.0 | 16.6 | 1.6 | 9.7 | 0.8 | 578 | 17 |
| Chicken Mince (lean) | Chicken | 12 | 0.1 | 0.3 | 0.1 | 6.3 | 0.5 | 6 | 0 |
| Blue Crab (raw) | Crab/Lobster | 5 | 0.4 | 7.6 | 0.0 | 3.1 | 0.2 | 44 | 3 |
| Mud Crab / Kekda | Crab/Lobster | 4 | 0.3 | 7.0 | 0.0 | 2.8 | 0.2 | 38 | 2 |
| Lobster (raw) | Crab/Lobster | 18 | 0.0 | 1.5 | 0.0 | 1.7 | 0.1 | 10 | 0 |
| Whole Egg (hen) | Eggs | 149 | 2.0 | 0.9 | 0.5 | 0.1 | 0.1 | 47 | 0 |
| Egg White | Eggs | 0 | 0.0 | 0.1 | 0.4 | 0.1 | 0.0 | 4 | 0 |
| Egg Yolk | Eggs | 381 | 4.9 | 1.9 | 0.5 | 0.0 | 0.4 | 146 | 0 |
| Hard-Boiled Egg | Eggs | 149 | 2.2 | 1.1 | 0.5 | 0.1 | 0.1 | 44 | 0 |
| Duck Egg | Eggs | 184 | 3.8 | 5.4 | 0.5 | 0.2 | 0.3 | 80 | 0 |
| Quail Egg | Eggs | 156 | 1.4 | 1.6 | 0.8 | 0.1 | 0.2 | 66 | 0 |
| Rohu (Labeo rohita) | Freshwater Fish | 18 | 5.0 | 2.0 | 0.1 | 2.8 | 0.2 | 10 | 0 |
| Catla (Indian carp) | Freshwater Fish | 20 | 5.5 | 2.2 | 0.1 | 3.0 | 0.2 | 12 | 0 |
| Tilapia | Freshwater Fish | 14 | 3.8 | 1.6 | 0.1 | 3.9 | 0.2 | 24 | 0 |
| Trout (rainbow) | Freshwater Fish | 29 | 13.6 | 4.5 | 0.1 | 4.5 | 0.4 | 15 | 0 |
| Hilsa / Ilish | Freshwater Fish | 35 | 5.8 | 3.2 | 0.1 | 3.6 | 0.3 | 8 | 0 |
| Singhi (walking catfish) | Freshwater Fish | 15 | 4.0 | 1.8 | 0.1 | 2.5 | 0.2 | 9 | 0 |
| Lamb Chop (lean) | Lamb | 0 | 0.1 | 2.7 | 0.3 | 6.3 | 0.2 | 23 | 0 |
| Lamb Leg (lean) | Lamb | 0 | 0.1 | 2.9 | 0.2 | 6.8 | 0.2 | 25 | 0 |
| Lamb Shoulder | Lamb | 0 | 0.1 | 2.5 | 0.2 | 6.1 | 0.2 | 20 | 0 |
| Lamb Mince (lean) | Lamb | 0 | 0.1 | 2.6 | 0.2 | 6.0 | 0.2 | 22 | 0 |
| Salmon (Atlantic) | Marine Fish | 50 | 11.1 | 3.2 | 0.1 | 7.9 | 0.8 | 25 | 3 |
| Tuna (yellowfin, raw) | Marine Fish | 20 | 4.9 | 2.2 | 0.3 | 10.5 | 0.9 | 2 | 0 |
| Tuna (canned in water) | Marine Fish | 20 | 4.0 | 2.0 | 0.2 | 9.8 | 0.4 | 4 | 0 |
| Mackerel / Bangda | Marine Fish | 28 | 16.1 | 8.7 | 0.3 | 9.1 | 0.5 | 1 | 0 |
| Sardine | Marine Fish | 25 | 4.8 | 8.9 | 0.2 | 5.2 | 0.3 | 10 | 0 |
| Pomfret / Paplet | Marine Fish | 18 | 3.5 | 1.8 | 0.1 | 2.9 | 0.2 | 8 | 0 |
| Surmai / Kingfish | Marine Fish | 20 | 4.0 | 2.0 | 0.1 | 3.2 | 0.2 | 9 | 0 |
| Rawas / Indian Salmon | Marine Fish | 25 | 6.5 | 2.5 | 0.1 | 4.5 | 0.4 | 10 | 0 |
| Bombil / Bombay Duck | Marine Fish | 12 | 2.0 | 1.2 | 0.1 | 1.8 | 0.1 | 5 | 0 |
| Nethili / Anchovies | Marine Fish | 15 | 3.0 | 2.5 | 0.1 | 3.5 | 0.2 | 6 | 0 |
| Cod (Atlantic) | Marine Fish | 12 | 1.0 | 0.9 | 0.1 | 2.1 | 0.2 | 7 | 0 |
| Seer Fish / Vanjaram | Marine Fish | 22 | 4.5 | 2.2 | 0.1 | 3.8 | 0.3 | 10 | 0 |
| Mutton/Goat Leg | Mutton/Goat | 0 | 0.1 | 2.5 | 0.2 | 5.7 | 0.1 | 3 | 0 |
| Mutton/Goat Shoulder | Mutton/Goat | 0 | 0.1 | 2.4 | 0.2 | 5.5 | 0.1 | 3 | 0 |
| Mutton/Goat Ribs | Mutton/Goat | 0 | 0.1 | 2.0 | 0.2 | 4.8 | 0.1 | 2 | 0 |
| Mutton/Goat Liver | Mutton/Goat | 6582 | 1.0 | 65.0 | 2.5 | 15.2 | 0.4 | 280 | 2 |
| Mutton/Goat Keema (lean) | Mutton/Goat | 0 | 0.1 | 2.5 | 0.2 | 5.6 | 0.1 | 3 | 0 |
| Squid / Calamari | Other Seafood | 10 | 0.0 | 1.3 | 0.4 | 2.2 | 0.1 | 6 | 4 |
| Octopus | Other Seafood | 30 | 0.0 | 36.0 | 0.0 | 2.1 | 0.4 | 16 | 5 |
| Mussels | Other Seafood | 48 | 0.0 | 12.0 | 0.2 | 1.6 | 0.1 | 42 | 8 |
| Oyster | Other Seafood | 26 | 0.0 | 8.8 | 0.2 | 1.5 | 0.1 | 10 | 4 |
| Scallop | Other Seafood | 2 | 0.0 | 1.4 | 0.0 | 0.8 | 0.1 | 16 | 0 |
| Pork Tenderloin (lean) | Pork | 2 | 0.7 | 0.6 | 0.3 | 6.3 | 0.6 | 3 | 0 |
| Pork Chop (lean) | Pork | 2 | 0.5 | 0.5 | 0.2 | 5.9 | 0.5 | 3 | 0 |
| Pork Belly | Pork | 9 | 0.4 | 0.6 | 0.1 | 4.5 | 0.3 | 2 | 0 |
| Bacon (pan-fried) | Pork | 0 | 0.4 | 0.8 | 0.2 | 8.3 | 0.3 | 1 | 0 |
| Pork Sausage (fresh) | Pork | 0 | 0.5 | 0.5 | 0.1 | 4.8 | 0.2 | 2 | 0 |
| Tiger Prawn / Jhinga | Shrimp/Prawns | 30 | 0.0 | 1.1 | 0.0 | 2.6 | 0.2 | 14 | 0 |
| White Shrimp (raw) | Shrimp/Prawns | 28 | 0.0 | 1.0 | 0.0 | 2.5 | 0.1 | 12 | 0 |
| Cooked Shrimp | Shrimp/Prawns | 31 | 0.0 | 1.5 | 0.0 | 2.8 | 0.2 | 14 | 0 |
Vitamin Notes: Vit A — Liver is extremely concentrated; consuming large amounts of liver frequently can cause Vit A toxicity. 1–2 servings/week is safe and sufficient. Vit D — Mackerel (16.1 µg), Trout (13.6 µg), and Salmon (11.1 µg) can each cover the daily RDA in a single serving. Vit B12 — This vitamin is absent in plant foods. Goat liver (65 µg) and Beef liver (70.7 µg) contain ~29× the daily requirement in 100 g. Folate — Chicken liver (578 µg/100g) provides 144% of the adult daily folate RDA. Particularly important during early pregnancy.
Minerals — Complete Table (per 100 g, Raw)
Minerals are inorganic micronutrients essential for bone structure, fluid balance, nerve signalling, enzyme activity, oxygen transport, and antioxidant defence. Non-vegetarian foods provide several minerals in their most bioavailable forms — particularly haem iron (from meat) and zinc (from shellfish and red meat), both of which are absorbed more efficiently than their plant-food equivalents.
Understanding the Mineral Columns
Iron (mg): Haem iron from animal sources is absorbed at 15–35% efficiency, compared to 2–20% for non-haem iron from plants — making meat, fish, and poultry important for preventing iron-deficiency anaemia, the most common nutritional deficiency worldwide. Chicken liver tops the list at 8.5 mg/100g, followed by Goat liver (6.5 mg), Beef liver (6.2 mg), Goat leg (2.7 mg), Sardines (2.9 mg), and Nethili/Anchovies (3.3 mg). Even moderate fish and meat consumption significantly improves iron status. RDA: 8–18 mg/day.
Zinc (mg): Critical for immune function, wound healing, testosterone production, taste perception, and protein synthesis. Oyster contains 16.6 mg/100g — the highest zinc concentration of any food, providing nearly 2× the daily RDA in a single serving. Beef, lamb, crab, and goat meat are also excellent sources. Zinc from animal foods is significantly more bioavailable than from plant foods due to the absence of phytates. RDA: 8–11 mg/day.
Calcium (mg): The primary mineral for bone and teeth structure, muscle contraction, nerve signalling, and blood clotting. Most meats are poor calcium sources. However, Indian freshwater fish with edible small bones are exceptional: Rohu provides 650 mg/100g, Singhi 580 mg, Catla 530 mg. Marine fish also contribute: Sardines 382 mg, Bombil/Bombay Duck 450 mg, Pomfret 138 mg. The key is consuming these fish including their soft, edible bones (as is traditional in Indian cuisine). RDA: 1000 mg/day.
Potassium (mg): Essential for blood pressure regulation, heart rhythm, fluid balance, and muscle function. Often overlooked in non-vegetarian foods, several are excellent sources: Scallop (476 mg), Salmon (490 mg), Pork tenderloin (423 mg), Lobster (352 mg), Octopus (350 mg), Tuna raw (444 mg). RDA: 2600–3400 mg/day.
Selenium (µg): A potent antioxidant mineral critical for thyroid hormone metabolism, immunity, and protection from oxidative stress. Non-vegetarian foods are the dominant dietary source worldwide. Tuna canned in water provides 75.6 µg/100g — nearly 1.4× the daily RDA in one serving. Oyster (77 µg), Mackerel (41.6 µg), Sardine (52.7 µg), and Pork tenderloin (40.7 µg) are also exceptional. RDA: 55 µg/day.
Sodium (mg): Essential in small amounts for fluid balance and nerve function, but excess dietary sodium raises blood pressure and cardiovascular risk. Most raw meats and fish are naturally low in sodium (40–100 mg/100g) — it is cooking and processing that introduces excess sodium. The highest-sodium items in this database are: Bacon (2310 mg), Nethili/Anchovies (1040 mg), Pork Sausage (748 mg), and Canned Tuna (339 mg). Prefer fresh, unprocessed cuts. WHO limit: <2300 mg/day.
| Food Item | Category | Iron (mg) | Zinc (mg) | Calcium (mg) | Phosphorus (mg) | Potassium (mg) | Selenium (µg) | Magnesium (mg) | Sodium (mg) |
|---|---|---|---|---|---|---|---|---|---|
| Beef (90% lean mince) | Beef | 2.5 | 5.3 | 18 | 200 | 318 | 14.0 | 21 | 74 |
| Beef Sirloin (lean) | Beef | 2.2 | 4.5 | 11 | 213 | 340 | 26.6 | 24 | 60 |
| Beef Ribeye | Beef | 1.9 | 4.3 | 9 | 198 | 319 | 24.0 | 22 | 63 |
| Beef Liver | Beef | 6.2 | 4.0 | 5 | 497 | 313 | 36.1 | 18 | 69 |
| Chicken Breast (skinless) | Chicken | 0.7 | 1.0 | 11 | 220 | 256 | 27.6 | 29 | 74 |
| Chicken Thigh (skinless) | Chicken | 1.0 | 2.4 | 10 | 179 | 220 | 22.0 | 23 | 83 |
| Chicken Leg (with skin) | Chicken | 1.1 | 2.6 | 12 | 183 | 225 | 23.0 | 24 | 90 |
| Chicken Wings (with skin) | Chicken | 0.9 | 1.6 | 12 | 144 | 189 | 16.0 | 20 | 79 |
| Chicken Drumstick (skinless) | Chicken | 1.0 | 2.3 | 10 | 175 | 217 | 21.5 | 22 | 82 |
| Chicken Liver | Chicken | 8.5 | 3.3 | 11 | 297 | 263 | 54.6 | 19 | 71 |
| Chicken Mince (lean) | Chicken | 0.9 | 1.5 | 10 | 195 | 238 | 24.0 | 25 | 80 |
| Blue Crab (raw) | Crab/Lobster | 0.4 | 4.7 | 89 | 239 | 329 | 34.5 | 37 | 293 |
| Mud Crab / Kekda | Crab/Lobster | 0.4 | 4.5 | 80 | 225 | 310 | 30.0 | 32 | 280 |
| Lobster (raw) | Crab/Lobster | 0.2 | 2.5 | 96 | 240 | 352 | 59.4 | 37 | 423 |
| Whole Egg (hen) | Eggs | 1.8 | 1.3 | 50 | 198 | 138 | 30.7 | 12 | 142 |
| Egg White | Eggs | 0.1 | 0.0 | 7 | 15 | 163 | 9.1 | 9 | 166 |
| Egg Yolk | Eggs | 2.7 | 2.6 | 129 | 390 | 109 | 56.0 | 11 | 48 |
| Hard-Boiled Egg | Eggs | 1.2 | 1.1 | 50 | 172 | 126 | 30.8 | 10 | 124 |
| Duck Egg | Eggs | 3.8 | 1.4 | 64 | 220 | 222 | 36.4 | 17 | 146 |
| Quail Egg | Eggs | 3.7 | 1.5 | 64 | 226 | 132 | 32.0 | 12 | 141 |
| Rohu (Labeo rohita) | Freshwater Fish | 1.4 | 1.0 | 650 | 210 | 295 | 32.0 | 27 | 60 |
| Catla (Indian carp) | Freshwater Fish | 1.5 | 1.1 | 530 | 215 | 300 | 34.0 | 28 | 65 |
| Tilapia | Freshwater Fish | 0.6 | 0.4 | 10 | 170 | 302 | 54.4 | 27 | 56 |
| Trout (rainbow) | Freshwater Fish | 0.3 | 0.6 | 67 | 271 | 481 | 12.6 | 28 | 52 |
| Hilsa / Ilish | Freshwater Fish | 1.7 | 1.5 | 173 | 252 | 330 | 35.0 | 32 | 74 |
| Singhi (walking catfish) | Freshwater Fish | 1.2 | 0.8 | 580 | 195 | 270 | 28.0 | 24 | 58 |
| Lamb Chop (lean) | Lamb | 1.7 | 4.4 | 14 | 192 | 310 | 25.0 | 22 | 71 |
| Lamb Leg (lean) | Lamb | 1.8 | 4.6 | 14 | 195 | 315 | 26.0 | 24 | 67 |
| Lamb Shoulder | Lamb | 1.6 | 4.2 | 13 | 185 | 298 | 24.0 | 21 | 72 |
| Lamb Mince (lean) | Lamb | 1.7 | 4.3 | 13 | 190 | 305 | 24.5 | 22 | 70 |
| Salmon (Atlantic) | Marine Fish | 0.3 | 0.6 | 12 | 252 | 490 | 36.5 | 29 | 59 |
| Tuna (yellowfin, raw) | Marine Fish | 0.4 | 0.4 | 4 | 278 | 444 | 36.5 | 64 | 47 |
| Tuna (canned in water) | Marine Fish | 0.9 | 0.5 | 11 | 217 | 237 | 75.6 | 30 | 339 |
| Mackerel / Bangda | Marine Fish | 1.6 | 0.8 | 12 | 217 | 314 | 41.6 | 76 | 90 |
| Sardine | Marine Fish | 2.9 | 1.3 | 382 | 490 | 397 | 52.7 | 39 | 307 |
| Pomfret / Paplet | Marine Fish | 0.9 | 0.7 | 138 | 183 | 280 | 30.0 | 25 | 70 |
| Surmai / Kingfish | Marine Fish | 0.8 | 0.6 | 120 | 190 | 290 | 32.0 | 26 | 68 |
| Rawas / Indian Salmon | Marine Fish | 0.7 | 0.5 | 85 | 200 | 310 | 28.0 | 24 | 62 |
| Bombil / Bombay Duck | Marine Fish | 0.5 | 0.4 | 450 | 105 | 190 | 22.0 | 15 | 55 |
| Nethili / Anchovies | Marine Fish | 3.3 | 1.8 | 232 | 252 | 383 | 36.5 | 39 | 1040 |
| Cod (Atlantic) | Marine Fish | 0.4 | 0.5 | 16 | 203 | 413 | 32.8 | 38 | 247 |
| Seer Fish / Vanjaram | Marine Fish | 1.0 | 0.7 | 145 | 195 | 300 | 33.0 | 27 | 72 |
| Mutton/Goat Leg | Mutton/Goat | 2.7 | 4.0 | 9 | 174 | 310 | 12.5 | 20 | 72 |
| Mutton/Goat Shoulder | Mutton/Goat | 2.5 | 3.8 | 9 | 168 | 298 | 11.8 | 19 | 75 |
| Mutton/Goat Ribs | Mutton/Goat | 2.2 | 3.5 | 8 | 145 | 260 | 10.2 | 16 | 68 |
| Mutton/Goat Liver | Mutton/Goat | 6.5 | 4.0 | 8 | 295 | 310 | 42.0 | 20 | 76 |
| Mutton/Goat Keema (lean) | Mutton/Goat | 2.6 | 3.9 | 9 | 170 | 305 | 12.0 | 19 | 73 |
| Squid / Calamari | Other Seafood | 0.7 | 1.5 | 32 | 221 | 246 | 44.8 | 33 | 221 |
| Octopus | Other Seafood | 5.3 | 2.1 | 53 | 186 | 350 | 44.8 | 30 | 230 |
| Mussels | Other Seafood | 3.9 | 2.7 | 33 | 285 | 268 | 44.8 | 34 | 286 |
| Oyster | Other Seafood | 5.1 | 16.6 | 59 | 135 | 156 | 77.0 | 22 | 85 |
| Scallop | Other Seafood | 0.2 | 0.9 | 24 | 334 | 476 | 22.2 | 55 | 161 |
| Pork Tenderloin (lean) | Pork | 1.3 | 2.2 | 4 | 226 | 423 | 40.7 | 28 | 53 |
| Pork Chop (lean) | Pork | 1.1 | 2.0 | 5 | 198 | 378 | 35.0 | 24 | 60 |
| Pork Belly | Pork | 0.5 | 1.2 | 3 | 116 | 213 | 22.0 | 12 | 59 |
| Bacon (pan-fried) | Pork | 0.8 | 2.2 | 17 | 302 | 565 | 35.0 | 22 | 2310 |
| Pork Sausage (fresh) | Pork | 0.9 | 1.8 | 8 | 168 | 278 | 14.8 | 14 | 748 |
| Tiger Prawn / Jhinga | Shrimp/Prawns | 0.5 | 1.1 | 52 | 205 | 259 | 38.0 | 37 | 119 |
| White Shrimp (raw) | Shrimp/Prawns | 0.5 | 1.0 | 55 | 198 | 250 | 35.0 | 35 | 119 |
| Cooked Shrimp | Shrimp/Prawns | 0.3 | 1.6 | 70 | 137 | 155 | 46.0 | 34 | 224 |
Mineral Notes: Iron — Haem iron from meat is 2–3× more bioavailable than plant iron. Pair with Vitamin C (lemon, tomato) to further enhance absorption. Zinc — Oyster (16.6 mg) and Blue Crab (4.7 mg) are the standout shellfish sources. Beef sirloin (4.5 mg) and lamb (4.4 mg) lead among meats. Calcium — Rohu (650 mg), Singhi (580 mg), and Catla (530 mg) are exceptional when consumed with their soft bones (as in traditional Indian preparations). Sodium — Most raw meats are low in sodium; sodium spikes come from processing. Bacon has 2310 mg/100g — nearly a full day’s limit in one serving
Per Serving Nutrition — Real-World Portion Sizes
The 100 g values in Sections 4–6 are the scientific standard for comparison — but nobody measures their food in precisely 100 g portions. This section provides practical, real-world serving sizes that reflect how these foods are actually consumed in Indian and international cuisine contexts.
Serving sizes used here are drawn directly from the Excel Per Serving sheet in this nutrition database and are consistent with ICMR portion size guidelines and common restaurant/home-cooking practices. For example: 1 large hen egg = 50 g, 1 medium chicken piece = 150 g, 1 medium fish fillet = 120 g, ~10 medium prawns (shell-off) = 100 g.
The table below shows Calories, Protein, Total Fat, Saturated Fat, Cholesterol, Vitamin B12, and Iron scaled to the typical serving size for each food. Use this section to understand what you actually consume in a meal, rather than an abstract 100 g value.
Serving size key: Chicken 150g = 1 medium piece | Mutton/Goat/Beef/Lamb 120–150g = 1 restaurant/home serving | Eggs 50g = 1 large egg | Fish 120g = 1 boneless medium fillet | Prawns 100g ≈ 10 medium shell-off | Crab/Lobster/Seafood 100g = 1 standard serving. Bone-in cuts (mutton ribs, fish whole) will have less edible protein per serving weight.
| Food Item | Category | Serving | Size (g) | Calories (kcal) | Protein (g) | Total Fat (g) | Sat. Fat (g) | Carbs (g) | Fiber (g) | Cholesterol (mg) |
|---|---|---|---|---|---|---|---|---|---|---|
| Tiger Prawn / Jhinga | Shrimp/Prawns | ~10 medium (shell-off) | 100 | 99.0 | 20.3 | 1.4 | 0.3 | 0.2 | 0.0 | 152.0 |
| White Shrimp (raw) | Shrimp/Prawns | ~10 medium (shell-off) | 100 | 85.0 | 20.1 | 0.6 | 0.2 | 0.0 | 0.0 | 147.0 |
| Cooked Shrimp | Shrimp/Prawns | ~10 medium (shell-off) | 100 | 99.0 | 23.7 | 0.3 | 0.1 | 0.0 | 0.0 | 189.0 |
| Whole Egg (hen) | Eggs | 1 large egg | 50 | 71.5 | 6.3 | 4.8 | 1.6 | 0.3 | 0.0 | 186.0 |
| Egg White | Eggs | 1 large egg | 50 | 26.0 | 5.5 | 0.1 | 0.0 | 0.3 | 0.0 | 0.0 |
| Egg Yolk | Eggs | 1 large egg | 50 | 161.0 | 8.0 | 13.2 | 4.3 | 1.8 | 0.0 | 542.5 |
| Hard-Boiled Egg | Eggs | 1 large egg | 50 | 77.5 | 6.3 | 5.3 | 1.6 | 0.6 | 0.0 | 186.5 |
| Duck Egg | Eggs | 1 large egg | 50 | 92.5 | 6.4 | 6.9 | 1.9 | 0.8 | 0.0 | 442.0 |
| Quail Egg | Eggs | 1 large egg | 50 | 79.0 | 6.5 | 5.5 | 1.8 | 0.2 | 0.0 | 422.0 |
| Rohu (Labeo rohita) | Freshwater Fish | 1 medium fillet | 120 | 116.4 | 20.5 | 3.2 | 0.8 | 0.0 | 0.0 | 66.0 |
| Catla (Indian carp) | Freshwater Fish | 1 medium fillet | 120 | 133.2 | 22.8 | 4.2 | 1.1 | 0.0 | 0.0 | 69.6 |
| Tilapia | Freshwater Fish | 1 medium fillet | 120 | 115.2 | 24.1 | 2.0 | 0.7 | 0.0 | 0.0 | 60.0 |
| Trout (rainbow) | Freshwater Fish | 1 medium fillet | 120 | 180.0 | 25.8 | 7.9 | 2.3 | 0.0 | 0.0 | 70.8 |
| Hilsa / Ilish | Freshwater Fish | 1 medium fillet | 120 | 327.6 | 26.2 | 23.3 | 6.4 | 0.0 | 0.0 | 92.4 |
| Singhi (walking catfish) | Freshwater Fish | 1 medium fillet | 120 | 104.4 | 19.2 | 2.8 | 0.7 | 0.0 | 0.0 | 63.6 |
| Salmon (Atlantic) | Marine Fish | 1 medium fillet | 120 | 249.6 | 24.5 | 16.1 | 3.7 | 0.0 | 0.0 | 75.6 |
| Tuna (yellowfin, raw) | Marine Fish | 1 medium fillet | 120 | 130.8 | 29.3 | 0.6 | 0.1 | 0.0 | 0.0 | 58.8 |
| Tuna (canned in water) | Marine Fish | 1 medium fillet | 120 | 139.2 | 30.6 | 1.0 | 0.2 | 0.0 | 0.0 | 55.2 |
| Mackerel / Bangda | Marine Fish | 1 medium fillet | 120 | 246.0 | 22.3 | 16.7 | 4.0 | 0.0 | 0.0 | 90.0 |
| Sardine | Marine Fish | 1 medium fillet | 120 | 249.6 | 29.5 | 13.8 | 1.8 | 0.0 | 0.0 | 170.4 |
| Pomfret / Paplet | Marine Fish | 1 medium fillet | 120 | 118.8 | 21.6 | 3.6 | 1.1 | 0.0 | 0.0 | 62.4 |
| Surmai / Kingfish | Marine Fish | 1 medium fillet | 120 | 120.0 | 23.8 | 2.6 | 0.8 | 0.0 | 0.0 | 64.8 |
| Rawas / Indian Salmon | Marine Fish | 1 medium fillet | 120 | 152.4 | 24.1 | 5.9 | 1.4 | 0.0 | 0.0 | 69.6 |
| Bombil / Bombay Duck | Marine Fish | 1 medium fillet | 120 | 62.4 | 12.4 | 1.1 | 0.2 | 0.0 | 0.0 | 48.0 |
| Nethili / Anchovies | Marine Fish | 1 medium fillet | 120 | 157.2 | 24.5 | 5.8 | 1.6 | 0.0 | 0.0 | 102.0 |
| Cod (Atlantic) | Marine Fish | 1 medium fillet | 120 | 98.4 | 21.4 | 0.8 | 0.1 | 0.0 | 0.0 | 51.6 |
| Seer Fish / Vanjaram | Marine Fish | 1 medium fillet | 120 | 136.8 | 27.0 | 3.4 | 0.8 | 0.0 | 0.0 | 67.2 |
| Chicken Breast (skinless) | Chicken | 1 piece | 150 | 247.5 | 46.5 | 5.4 | 1.5 | 0.0 | 0.0 | 127.5 |
| Chicken Thigh (skinless) | Chicken | 1 piece | 150 | 268.5 | 36.8 | 12.5 | 3.4 | 0.0 | 0.0 | 139.5 |
| Chicken Leg (with skin) | Chicken | 1 piece | 150 | 322.5 | 33.0 | 20.2 | 5.6 | 0.0 | 0.0 | 136.5 |
| Chicken Wings (with skin) | Chicken | 1 piece | 150 | 399.0 | 33.6 | 28.2 | 7.9 | 0.0 | 0.0 | 144.0 |
| Chicken Drumstick (skinless) | Chicken | 1 piece | 150 | 258.0 | 36.3 | 12.0 | 3.2 | 0.0 | 0.0 | 130.5 |
| Chicken Liver | Chicken | 1 piece | 150 | 178.5 | 25.3 | 7.2 | 2.4 | 1.4 | 0.0 | 658.5 |
| Chicken Mince (lean) | Chicken | 1 piece | 150 | 214.5 | 26.1 | 12.1 | 3.3 | 0.0 | 0.0 | 132.0 |
| Mutton/Goat Leg | Mutton/Goat | 1 serving | 120 | 261.6 | 24.6 | 17.5 | 7.3 | 0.0 | 0.0 | 90.0 |
| Mutton/Goat Shoulder | Mutton/Goat | 1 serving | 120 | 280.8 | 23.8 | 19.8 | 8.4 | 0.0 | 0.0 | 93.6 |
| Mutton/Goat Ribs | Mutton/Goat | 1 serving | 120 | 350.4 | 21.8 | 28.8 | 12.2 | 0.0 | 0.0 | 98.4 |
| Mutton/Goat Liver | Mutton/Goat | 1 serving | 120 | 171.6 | 24.6 | 6.4 | 2.2 | 4.6 | 0.0 | 466.8 |
| Mutton/Goat Keema (lean) | Mutton/Goat | 1 serving | 120 | 261.6 | 21.5 | 19.2 | 8.0 | 0.0 | 0.0 | 91.2 |
| Beef (90% lean mince) | Beef | 1 serving | 150 | 264.0 | 30.0 | 15.0 | 5.7 | 0.0 | 0.0 | 114.0 |
| Beef Sirloin (lean) | Beef | 1 serving | 150 | 310.5 | 39.3 | 15.9 | 6.1 | 0.0 | 0.0 | 133.5 |
| Beef Ribeye | Beef | 1 serving | 150 | 436.5 | 36.6 | 31.2 | 13.0 | 0.0 | 0.0 | 142.5 |
| Beef Liver | Beef | 1 serving | 150 | 262.5 | 39.6 | 7.5 | 2.8 | 7.6 | 0.0 | 583.5 |
| Pork Tenderloin (lean) | Pork | 1 serving | 130 | 185.9 | 28.2 | 7.3 | 2.5 | 0.0 | 0.0 | 94.9 |
| Pork Chop (lean) | Pork | 1 serving | 130 | 271.7 | 30.7 | 16.0 | 5.5 | 0.0 | 0.0 | 101.4 |
| Pork Belly | Pork | 1 serving | 130 | 673.4 | 12.1 | 68.9 | 25.1 | 0.0 | 0.0 | 93.6 |
| Bacon (pan-fried) | Pork | 1 serving | 130 | 703.3 | 48.1 | 54.6 | 18.7 | 1.8 | 0.0 | 143.0 |
| Pork Sausage (fresh) | Pork | 1 serving | 130 | 440.7 | 19.4 | 38.7 | 13.5 | 2.6 | 0.0 | 102.7 |
| Lamb Chop (lean) | Lamb | 1 serving | 130 | 335.4 | 31.9 | 22.5 | 9.5 | 0.0 | 0.0 | 126.1 |
| Lamb Leg (lean) | Lamb | 1 serving | 130 | 248.3 | 36.4 | 10.8 | 4.0 | 0.0 | 0.0 | 110.5 |
| Lamb Shoulder | Lamb | 1 serving | 130 | 328.9 | 28.3 | 23.1 | 9.8 | 0.0 | 0.0 | 118.3 |
| Lamb Mince (lean) | Lamb | 1 serving | 130 | 292.5 | 26.0 | 20.4 | 8.5 | 0.0 | 0.0 | 114.4 |
| Blue Crab (raw) | Crab/Lobster | 1 serving | 100 | 87.0 | 18.1 | 1.1 | 0.2 | 0.0 | 0.0 | 78.0 |
| Mud Crab / Kekda | Crab/Lobster | 1 serving | 100 | 80.0 | 17.1 | 0.8 | 0.2 | 0.0 | 0.0 | 72.0 |
| Lobster (raw) | Crab/Lobster | 1 serving | 100 | 89.0 | 18.8 | 0.9 | 0.2 | 0.5 | 0.0 | 95.0 |
| Squid / Calamari | Other Seafood | 1 serving | 100 | 92.0 | 15.6 | 1.4 | 0.4 | 3.1 | 0.0 | 233.0 |
| Octopus | Other Seafood | 1 serving | 100 | 82.0 | 14.9 | 1.0 | 0.2 | 2.2 | 0.0 | 48.0 |
| Mussels | Other Seafood | 1 serving | 100 | 86.0 | 11.9 | 2.2 | 0.4 | 3.7 | 0.0 | 28.0 |
| Oyster | Other Seafood | 1 serving | 100 | 69.0 | 7.1 | 2.5 | 0.6 | 3.9 | 0.0 | 53.0 |
| Scallop | Other Seafood | 1 serving | 100 | 88.0 | 16.8 | 0.8 | 0.1 | 2.4 | 0.0 | 33.0 |
Per Serving Notes: 1 egg (50g) provides ~6.3g protein, ~5g fat, ~186mg cholesterol, ~1.0µg Vit D, and ~0.45µg B12 — under 75 kcal. A 150g chicken breast serving delivers ~46.5g protein at only ~248 kcal — one of the best lean protein servings available. A 120g mackerel fillet provides ~19.3µg Vit D (over the daily RDA) and 22g protein. Cooked shrimp (100g serving) provides ~23.7g protein, ~189mg cholesterol but only 0.3g fat — cholesterol from very-low-fat sources has minimal cardiovascular impact. Goat/Chicken liver (120g serving) contains extraordinary B12, Vit A, iron, and folate — limit to 1–2 servings per week.
Key Nutrients and Their Functions — Quick Reference
The following table summarises the 11 most important nutrients found in non-vegetarian foods, their best sources from this database, their roles in the body, and the current ICMR/WHO Recommended Dietary Allowances (RDA) for adults.
| Nutrient | Best Non-Veg Sources | Function in the Body | RDA (ICMR/WHO) |
|---|---|---|---|
| Protein | Chicken breast, tuna, shrimp, egg white | Muscle repair, enzymes, immune function | 0.8–1 g/kg/day |
| Vitamin B12 | Liver, oyster, octopus, crab, salmon | Nerve function, DNA synthesis, red blood cells | 2.4 µg/day |
| Heme Iron | Chicken liver, beef liver, mutton, sardine | Oxygen transport, prevents anaemia | 8–18 mg/day |
| Zinc | Oyster (16.6 mg!), beef, lamb, crab | Immunity, wound healing, growth | 8–11 mg/day |
| Vitamin D | Mackerel (16.1 µg), salmon, trout, Rohu | Calcium absorption, bone & immune health | 15–20 µg/day |
| Omega-3 EPA/DHA | Salmon, Hilsa, Mackerel, Sardine | Heart health, brain function, anti-inflammation | 250–500 mg/day |
| Selenium | Tuna canned (75.6 µg), oyster, lobster | Antioxidant, thyroid function, immunity | 55 µg/day |
| Vitamin A | Goat liver (6582 µg!), beef liver, egg yolk | Vision, skin health, immune function | 700–900 µg RAE/day |
| Calcium | Rohu (650 mg), Singhi, Catla, Sardine | Bone & teeth strength, nerve signalling | 1000 mg/day |
| Potassium | Salmon, tuna, lobster, scallop | Blood pressure regulation, heart rhythm | 2600–3400 mg/day |
| Folate | Chicken liver (578 µg), beef liver, crab | Cell division, pregnancy health | 400 µg/day |
Nutrients Unique or Primarily Found in Non-Veg Foods
Vitamin B12 — Absent in all plant foods. Even small amounts of meat, fish, or eggs provide this critical nutrient. Deficiency over years leads to irreversible neurological damage.
Haem Iron — While iron exists in plants (non-haem), haem iron from animal sources is absorbed at 2–3× the rate. For individuals with iron-deficiency anaemia, animal foods are clinically recommended.
Long-chain Omega-3 (EPA & DHA) — ALA from flaxseed is a plant omega-3, but conversion to EPA/DHA in the body is less than 5% efficient. Direct EPA and DHA from fatty fish is essential for heart and brain health.
Complete Proteins — Plant proteins are often ‘incomplete’ (missing one or more essential amino acids). All meats, fish, and eggs provide all nine essential amino acids in a single food.
Zinc Bioavailability — Phytates in legumes and grains significantly inhibit zinc absorption. Animal foods have no such inhibitors, making their zinc far more bioavailable.
Category-by-Category Nutritional Highlights
Chicken
Chicken is the world’s most consumed meat protein and India’s leading non-vegetarian food. Its major advantage is versatility — skinless breast is one of the leanest high-protein foods available, while darker cuts (thigh, drumstick) offer more flavor and fat in proportions still considered moderate.
- Best protein-to-calorie ratio: Chicken breast — 31 g protein at only 165 kcal per 100 g
- Richest cut in nutrients: Chicken liver — 8.5 mg iron, 16.6 µg B12, 578 µg folate, 3296 µg Vit A per 100 g. Nutritionally exceptional but high in cholesterol (439 mg).
- Lowest fat option: Skinless chicken breast (3.6 g fat/100g). Removing skin reduces fat by ~40% in leg/thigh cuts.
- Niacin powerhouse: Chicken breast provides 7 mg niacin (B3) per 100 g — nearly the full daily requirement.
Mutton / Goat
Goat meat (called mutton in India) is a leaner red meat than international lamb or beef. It is consumed extensively across South Asia, the Middle East, and parts of Africa. Despite being a red meat, it is notably lower in total fat than beef or lamb when lean cuts are chosen.
- Leaner than beef: Goat leg has 14.6 g fat/100g vs beef ribeye at 20.8 g — and significantly less saturated fat.
- Rich in zinc: Goat leg provides 0 mg zinc/100g — important for immunity and testosterone.
- Goat liver is exceptional:0 µg B12 (27× the RDA), 6582 µg Vit A, 6.5 mg iron per 100 g. A weekly serving covers months of B12 needs.
- Moderate sodium: All cuts are naturally low in sodium (68–76 mg/100g) — good for blood pressure management.
Beef
Beef is the most zinc-dense of all common meats and provides significant B12 and haem iron. Lean cuts like sirloin are nutritious; fatty cuts like ribeye are calorie-dense but still nutrient-rich. Beef liver is among the most nutrient-dense single foods on earth.
- Highest zinc in meats: Beef (90% lean mince) provides 3 mg zinc/100g — the highest among all meat cuts in this database.
- Protein quality: Beef sirloin provides 2 g protein/100g with a complete amino acid profile.
- Beef liver — a nutrient superdense food: 70.7 µg B12, 4968 µg Vit A, 6.2 mg iron, 260 µg folate per 100 g. Limit to 70 g once or twice per week to avoid Vit A overconsumption.
Pork
Pork ranges dramatically — from pork tenderloin, one of the leanest meats available, to pork belly and bacon which are among the most calorie-dense foods in this database. Choose wisely within this category.
- Leanest cut: Pork tenderloin — 143 kcal, 21.7 g protein, 5.6 g fat, 53 mg sodium/100g. Nutritionally comparable to chicken breast.
- Most calorific: Pork belly — 518 kcal and 53 g fat per 100 g. Rich in saturated fat (19.3 g).
- Processed meats — caution: Bacon has 2310 mg sodium/100g (a full day’s limit) and 42 g fat. Sausage contains 748 mg sodium. Limit processed pork.
- Pork’s unique strength: Highest thiamine (Vitamin B1) content of all meats — important for carbohydrate metabolism and nerve function (not in this table but well established).
Lamb
Lamb is popular globally and particularly in North India, the Middle East, and Mediterranean cuisines. It is a rich red meat with excellent zinc and B12 content, and a distinctive flavor from its slightly higher fat content compared to beef.
- Best zinc-to-protein ratio in this database: Lamb leg — 6 mg zinc with 28.0 g protein per 100 g.
- Highest protein among lamb cuts: Lamb leg at 0 g/100g — higher than most chicken cuts.
- Folate content: Lamb chop (23 µg) and leg (25 µg) contain notable folate compared to other red meats.
Eggs
Eggs are often described as nature’s most complete food — providing complete protein, nearly every fat-soluble vitamin, essential minerals, and unique compounds like choline, lecithin, and lutein, all within roughly 70–80 calories for one large egg. The longstanding fear of eggs due to cholesterol has been substantially revised by modern nutrition science.
- Whole egg — complete nutrition: 12.6 g protein, Vit A (149 µg), Vit D (2.0 µg), B12 (0.9 µg), folate (47 µg), iron (1.8 mg) per 100g.
- Egg white — pure protein: 10.9 g protein, 52 kcal, 0.2 g fat, and zero cholesterol per 100 g. Ideal for high-protein, low-fat dietary goals.
- Egg yolk — nutrient depot: All the fat-soluble vitamins (A, D, E, K), choline, and most minerals are in the yolk. Also contains 1085 mg cholesterol per 100 g.
- Duck and quail eggs: Significantly higher in cholesterol (884 and 844 mg respectively) than hen eggs. Nutritionally richer but best consumed in moderation.
Current ICMR guidelines (2020) consider 1 whole egg per day safe for healthy adults. For those with cardiovascular risk factors, 3–4 whole eggs per week with unlimited egg whites is a common recommendation.
Freshwater Fish
Indian freshwater fish are nutritionally underappreciated globally but are dietary staples of exceptional nutritional quality. Varieties like Rohu, Catla, Singhi, and Hilsa are rich in protein, calcium (from edible small bones), Vitamin D, and omega-3 fats — particularly Hilsa, which is among the richest omega-3 fish in the world.
- Calcium from edible bones: Rohu (650 mg), Singhi (580 mg), Catla (530 mg) per 100 g — higher than many dairy products. The soft, edible bones are a major calcium source when consumed whole (as in traditional Indian preparations).
- Hilsa — India’s omega-3 fish: 19.4 g fat/100g, predominantly omega-3 EPA and DHA. One of the richest freshwater omega-3 fish globally.
- Tilapia — ultra-lean protein: Only 96 kcal and 1.7 g fat per 100 g with 20.1 g protein. Also the highest selenium (54.4 µg) among freshwater fish in this database.
- Trout — Vitamin D leader among freshwater fish: 6 µg Vit D per 100 g — approaching the daily RDA in a single serving.
Marine Fish
Marine fish are the gold standard for Vitamin D, omega-3 fatty acids, selenium, and lean protein. The variety of Indian marine fish — from the humble Bombil to the prized Surmai — provides enormous nutritional diversity across different fat levels, nutrient profiles, and calorie densities.
- Mackerel/Bangda — Vit D champion: 1 µg Vit D per 100 g, covering the full daily RDA. Also rich in omega-3s and niacin.
- Tuna (canned) — selenium powerhouse: 6 µg selenium per 100 g (nearly 1.4× daily RDA) and 25.5 g protein. Very convenient and affordable.
- Sardines — bone-in calcium: 382 mg calcium per 100 g when consumed with bones. Also 52.7 µg selenium and 8.9 µg B12.
- Bombil (Bombay Duck) — lightest fish: Only 52 kcal and 0.9 g fat per 100 g, yet 450 mg calcium. Great for calorie-conscious diets.
- Nethili/Anchovies — iron-rich marine fish: 3 mg iron per 100 g — the highest among marine fish. Also 232 mg calcium.
Shrimp / Prawns
Shrimp and prawns are extremely lean, high-protein seafood with an outstanding protein-to-calorie ratio. Despite containing moderate cholesterol, their very low fat content means their overall cardiovascular impact is considered minimal for most healthy adults. They are consumed widely across coastal India — Tiger Prawns (Jhinga) being the most popular variety.
- Best protein-to-calorie ratio among seafood: Cooked shrimp — 99 kcal, 7 g protein, only 0.3 g fat per 100 g.
- Selenium-rich: All shrimp varieties provide 35–46 µg selenium per 100 g — well above the 55 µg RDA after a normal serving.
- Cholesterol context: ~150–189 mg cholesterol per 100g, but with less than 1 g fat. Dietary cholesterol from very-low-fat foods has minimal effect on blood cholesterol levels for most people.
Crab / Lobster
Crab and lobster are premium shellfish with outstanding micronutrient profiles. They are low in calories and fat while being exceptionally rich in zinc (crab), selenium (lobster), and Vitamin B12 (crab). Mud crab (Kekda) is a common and affordable Indian variety.
- Blue Crab — B12 champion among shellfish: 6 µg B12 per 100 g — more than 3× the daily RDA in a single serving.
- Zinc in crab: Blue Crab (7 mg) and Mud Crab (4.5 mg) are among the highest zinc sources in this database outside of oyster.
- Lobster — selenium leader: 4 µg selenium per 100 g, exceeding the daily RDA. Also very low fat (0.9 g) and high protein (18.8 g).
Other Seafood (Squid, Octopus, Mussels, Oyster, Scallop)
This category contains some of the most nutritionally remarkable foods in the entire database — often overlooked in mainstream Indian nutrition discussions despite being consumed extensively in coastal regions.
- Oyster — zinc king of all foods: 6 mg zinc per 100 g — the highest of any food on earth, providing nearly 2× the daily RDA in one serving. Also 77 µg selenium and 8.8 µg B12.
- Octopus — extraordinary B12: 0 µg B12 per 100 g — 15× the daily RDA. Also 5.3 mg iron (comparable to liver). Low fat (1.0 g) and only 82 kcal.
- Mussels — iron and B12: 9 mg iron and 12.0 µg B12 per 100 g, with 44.8 µg selenium. An extremely nutrient-dense, affordable shellfish.
- Scallop — potassium and phosphorus: 476 mg potassium and 334 mg phosphorus per 100 g — among the highest in this database for seafood.
- Squid — moderate cholesterol note: 233 mg cholesterol per 100 g (highest in this database), but only 1.4 g fat. Cholesterol from very-low-fat foods like squid is generally not a concern for healthy individuals.
Recommended Intake — ICMR, WHO & USDA Guidelines
ICMR-NIN (2020) — Dietary Guidelines for Indians
The Indian Council of Medical Research through its National Institute of Nutrition recommends the following for non-vegetarian food consumption in healthy Indian adults:
- Adults should aim for 50–100 g of lean meat or fish, or 1–2 eggs, daily as part of a balanced diet.
- Fish is recommended 2–3 times per week — oily varieties (Mackerel, Hilsa, Salmon, Sardine) are specifically encouraged for omega-3 and Vitamin D.
- Organ meats (liver, kidney) — consume in moderation: 1–2 times per week maximum, due to high cholesterol and Vitamin A content. Despite high nutrient density, excess is counterproductive.
- Red meat (beef, mutton, lamb, pork) — limit to 3–4 servings per week for optimal health outcomes.
- Processed meats (bacon, sausage, salami, deli meats) — limit severely or avoid. High sodium, preservatives (nitrites), and saturated fat are well-established cardiovascular and cancer risk factors (WHO classifies processed meats as Group 1 carcinogens).
- Eggs — 1 whole egg/day is safe for healthy adults; 3–4/week for those managing cardiovascular risk; unlimited egg whites.
WHO & FAO — International Perspective
- Diverse animal-source foods are recommended for micronutrient adequacy — especially critical for B12, zinc, haem iron, Vit D, and EPA/DHA.
- Fish and seafood are classified as low-saturated-fat, high-quality proteins and are actively recommended for all age groups, particularly children and pregnant women.
- Red meat: <500 g per week (cooked weight) to reduce risk of colorectal cancer (WHO/IARC). This is consistent with traditional Indian meat portions.
- Processed meats: Any regular consumption elevates cancer risk. Occasional consumption only.
Pregnant and lactating women: Increased need for iron (27 mg/day), folate (600 µg/day), and DHA (200 mg/day). Fish 2× weekly and daily eggs are specifically encouraged.
Practical Diet Tips
For Protein Optimisation
- Choose skinless chicken breast, fish fillets, egg whites, shrimp, and canned tuna for the highest protein-to-calorie ratio.
- Combine different non-veg proteins throughout the week to get a broad spectrum of amino acids and micronutrients.
- For muscle building: Aim for 1.6–2.2 g protein per kg body weight/day. Non-vegetarian foods make this significantly easier to achieve than plant-only diets.
For Micronutrient Coverage
- Include fatty fish (Mackerel, Salmon, Sardine) 2–3 times per week for Vitamin D and omega-3 EPA/DHA.
- Eat 1 egg daily — whole egg — for Vit A, D, B12, folate, and complete protein in one small package.
- Include small Indian fish (Rohu, Catla, Singhi) cooked in ways that preserve edible bones — a surprisingly powerful source of calcium.
- Add goat or chicken liver to your diet 1–2 times per week — 70–100 g covers your entire weekly B12, iron, folate, and Vit A needs.
- For selenium: Tuna (canned) or mackerel just twice per week virtually guarantees adequate selenium intake.
For Heart Health
- Prioritise fish and seafood over red meat. Marine and freshwater fish are uniformly low in saturated fat and rich in omega-3s.
- When eating red meat, choose lean cuts (goat leg over ribs, sirloin over ribeye) and trim visible fat.
- Avoid processed meats (bacon, sausage, salami) as a regular dietary habit — reserve for rare occasions.
- Cooking method matters: Grilling, baking, and steaming preserve nutrients and avoid adding fats. Deep frying adds 5–15 g fat per 100 g depending on absorption.
For Anaemia Prevention
- Eat chicken or goat liver regularly (even 50 g once per week) — haem iron is far superior to any iron supplement for bioavailability.
- Pair all meat and fish meals with Vitamin C-rich foods: lemon juice, tomato, amla, or capsicum. This enhances non-haem iron absorption by up to 3–fold.
- Sardines with edible bones provide both iron (2.9 mg) and calcium (382 mg) — valuable for women who are at higher risk for both iron deficiency and osteoporosis.
Frequently Asked Questions (FAQs)
Q1. Which non-vegetarian food has the highest protein per 100g?
Chicken breast (skinless) leads among everyday meats at 31 g protein per 100 g, followed by tuna yellowfin at 24.4 g and beef sirloin at 26.2 g. Among seafood, cooked shrimp provides 23.7 g protein at only 99 kcal — one of the highest protein-to-calorie ratios of any food. All non-vegetarian foods provide complete protein containing all nine essential amino acids.
Q2. How many calories are in 100g of chicken breast?
Raw skinless chicken breast contains 165 kcal per 100 g, with 31 g protein, 3.6 g fat, and 0 g carbohydrates. A typical serving of one medium chicken piece (150 g) provides approximately 248 kcal and 46.5 g protein, making it one of the most calorie-efficient protein sources available.
Q3. Do eggs raise cholesterol? How much cholesterol is in one egg?
One large hen egg (50 g) contains approximately 186 mg of cholesterol, almost entirely in the yolk. Current ICMR (2020) and international dietary guidelines recognise that dietary cholesterol has minimal impact on blood cholesterol for most healthy adults. Consuming 1 whole egg per day is considered safe for healthy individuals. The egg yolk also provides Vitamins A, D, B12, folate, and choline — nutrients absent in the egg white.
Q4. Is non-vegetarian food good for weight loss?
Yes — lean non-vegetarian foods are highly effective for weight loss. They are high in protein (which increases satiety and preserves muscle mass during caloric deficit), very low in carbohydrates, and efficiently absorbed. Best choices for weight loss include skinless chicken breast (165 kcal, 31 g protein), cooked shrimp (99 kcal, 23.7 g protein), tuna in water (116 kcal, 25.5 g protein), and white fish like Cod (82 kcal) or Bombil (52 kcal) per 100 g. Avoid processed meats like bacon and sausage, which are calorie-dense and high in sodium.
Q5. Is liver safe to eat regularly? How often should you eat liver?
Liver from chicken, goat, or beef is extraordinarily nutrient-dense — providing exceptional amounts of Vitamin B12, iron, Vitamin A, and folate in a single serving. However, because Vitamin A can accumulate to toxic levels (hypervitaminosis A) and liver is high in cholesterol, consumption should be limited to 1–2 servings per week of 70–100 g. This frequency provides all the nutritional benefits of organ meat without any risk of overconsumption. Pregnant women should be especially cautious with large amounts of liver due to the risk of Vitamin A excess.
Q6. How many calories does one prawn serving have?
A standard serving of approximately 10 medium tiger prawns (shell-off, ~100 g raw) provides 99 kcal, 20.3 g protein, 1.4 g fat, and 152 mg cholesterol. Cooked shrimp at the same serving size provides 99 kcal and 23.7 g protein with only 0.3 g fat — an exceptionally lean, high-protein serving.
Final Summary
What This Data Tells Us
Non-vegetarian foods are, collectively, among the most nutritionally complete food sources available to humans. Across all 60 foods in this database, the data reveals a consistent picture: these foods deliver high-quality complete protein, are the primary dietary sources of Vitamin B12 and haem iron, provide exceptional concentrations of Vitamin D (particularly fatty fish), and supply minerals like zinc and selenium in highly bioavailable forms.
At the same time, the data shows clear variation within categories that matters enormously for dietary decision-making. Pork tenderloin and pork belly are both ‘pork’ — but their calorie and fat content differs by 3.6-fold. A chicken breast and a chicken liver share the same category but have vastly different nutritional profiles. A Bombil fish and Hilsa are both Indian fish — but one provides 52 kcal/100g with exceptional calcium, while the other provides 273 kcal/100g as one of the world’s richest omega-3 fish.
The Most Important Takeaways
- Protein quality: Every food in this database provides complete protein with all essential amino acids. Animal protein bioavailability is consistently higher than plant protein.
- Vitamin B12 is exclusively non-vegetarian: There is no plant source of true B12. Even modest consumption of fish, eggs, or meat ensures adequate B12 intake. Strict vegetarians must supplement.
- Indian freshwater fish are calcium champions: Rohu (650mg), Singhi (580mg), and Catla (530mg) per 100g — rivalling or exceeding dairy when consumed with edible bones. A culturally normal practice in Bengal, Odisha, and Assam.
- Fatty fish 2–3x/week covers Vitamin D needs: Mackerel (16.1µg), Trout (13.6µg), Salmon (11.1µg) — each providing the full daily RDA in a single medium fillet.
- Oyster is the world’s best zinc source: At 16.6mg/100g, a single 100g serving provides nearly twice the adult daily RDA for zinc — no other food comes close.
- Processed meats are the exception, not the rule: Bacon, sausage, and salami are high in sodium, saturated fat, and preservatives. All other meats in this database — when consumed fresh and in appropriate portions — are genuinely nutritious.
- Liver once a week is extraordinary nutrition: 70–100g of goat or chicken liver covers your entire week’s B12, iron, folate, and Vitamin A needs in one serving. This is one of the most nutrient-dense foods on earth.
- Eggs are misunderstood: Modern guidelines consider 1 whole egg per day safe for healthy adults. The yolk contains Vitamins A, D, E, K, B12, and choline. The white is pure protein. Together, the whole egg is one of nature’s most complete single foods.
Building a Balanced Non-Vegetarian Diet
Based on the nutritional data in this document, an optimal non-vegetarian dietary pattern for an Indian adult would include:
- Daily: 1 whole egg (or 2–3 egg whites), and 100–150g of lean meat or fish
- 3× weekly: Oily fish (Mackerel, Hilsa, Salmon, Sardine) for Vitamin D and omega-3 EPA/DHA
- 1–2× weekly: Freshwater fish (Rohu, Catla, Singhi) cooked with edible bones for calcium
- 1× weekly: 70–100g of liver (chicken or goat) for B12, iron, folate, and Vitamin A
- Occasionally: Shellfish (prawns, crab, oyster) for zinc, selenium, and B12
- Limit to rare occasions: Bacon, sausage, salami, and other processed meats
A Word on Dietary Balance
Non-vegetarian foods are nutritionally powerful — but they are most effective as part of a balanced diet that also includes vegetables, fruits, whole grains, legumes, and dairy. Plant foods provide dietary fibre, phytonutrients, Vitamin C, and most Vitamin K that animal foods cannot. The ideal diet integrates both, using non-vegetarian foods for their unique nutritional strengths — complete protein, B12, haem iron, omega-3s, zinc, and Vitamin D — and plant foods for everything else.
It is also worth recognising that cooking method matters as much as food choice. A grilled mackerel is one of the healthiest meals possible. The same mackerel deep-fried in hydrogenated oil, heavily salted, and served with processed carbohydrates is a very different nutritional proposition. The data in this reading represents the food in its raw, base state — what you do with it in the kitchen determines the final nutritional outcome.
Good nutrition is not about individual superfoods — it is about consistent patterns over time. Including a variety of non-vegetarian foods — lean meats, fatty fish, eggs, shellfish, and occasional organ meats — across the week, combined with adequate plant foods, is one of the most evidence-based dietary approaches for long-term health, cognitive function, and physical performance.
Data Sources & Disclaimer
- USDA FoodData Central (fdc.nal.usda.gov) — International nutritional reference
- NIN Hyderabad — Indian Food Composition Tables 2017 (ICMR) — Primary source for Indian foods (https://www.nin.res.in)
- WHO/ICMR Dietary Reference Values & Dietary Guidelines for Indians (2020)
- FAO Food Composition Database — Additional international reference
All values are for raw, uncooked food per 100 g unless specified. Values are approximate and may vary with breed, geographic origin, animal age, and season. This document is for educational purposes only and does not constitute medical, nutritional, or clinical advice. Consult a registered dietitian for personalised nutrition guidance.
Explore More
Nutrient content of Legumes and Pulses
Nutrient content of Milk and Milk products